Figure 5. Ingenuity pathway analysis (IPA) core analysis of the top 22 canonical pathways, most enriched, in our mouse retinal total
phosphoproteome data set, reflecting the diverse functional classifications of identified retinal proteins. Each canonical
listed has a minimum of 50 interacting proteins. The actual number or interacting proteins is indicated by the number above
the lines connecting the different pathways. “Top” canonicals are determined based on the number of molecules identified in
a dataset that are also found in IPA’s predefined canonicals. P values listed adjacent to each canonical describe the “p-value
of overlap” of the proteins in our dataset that are contained in that canonical relative to the proteins that define the entire
canonical.
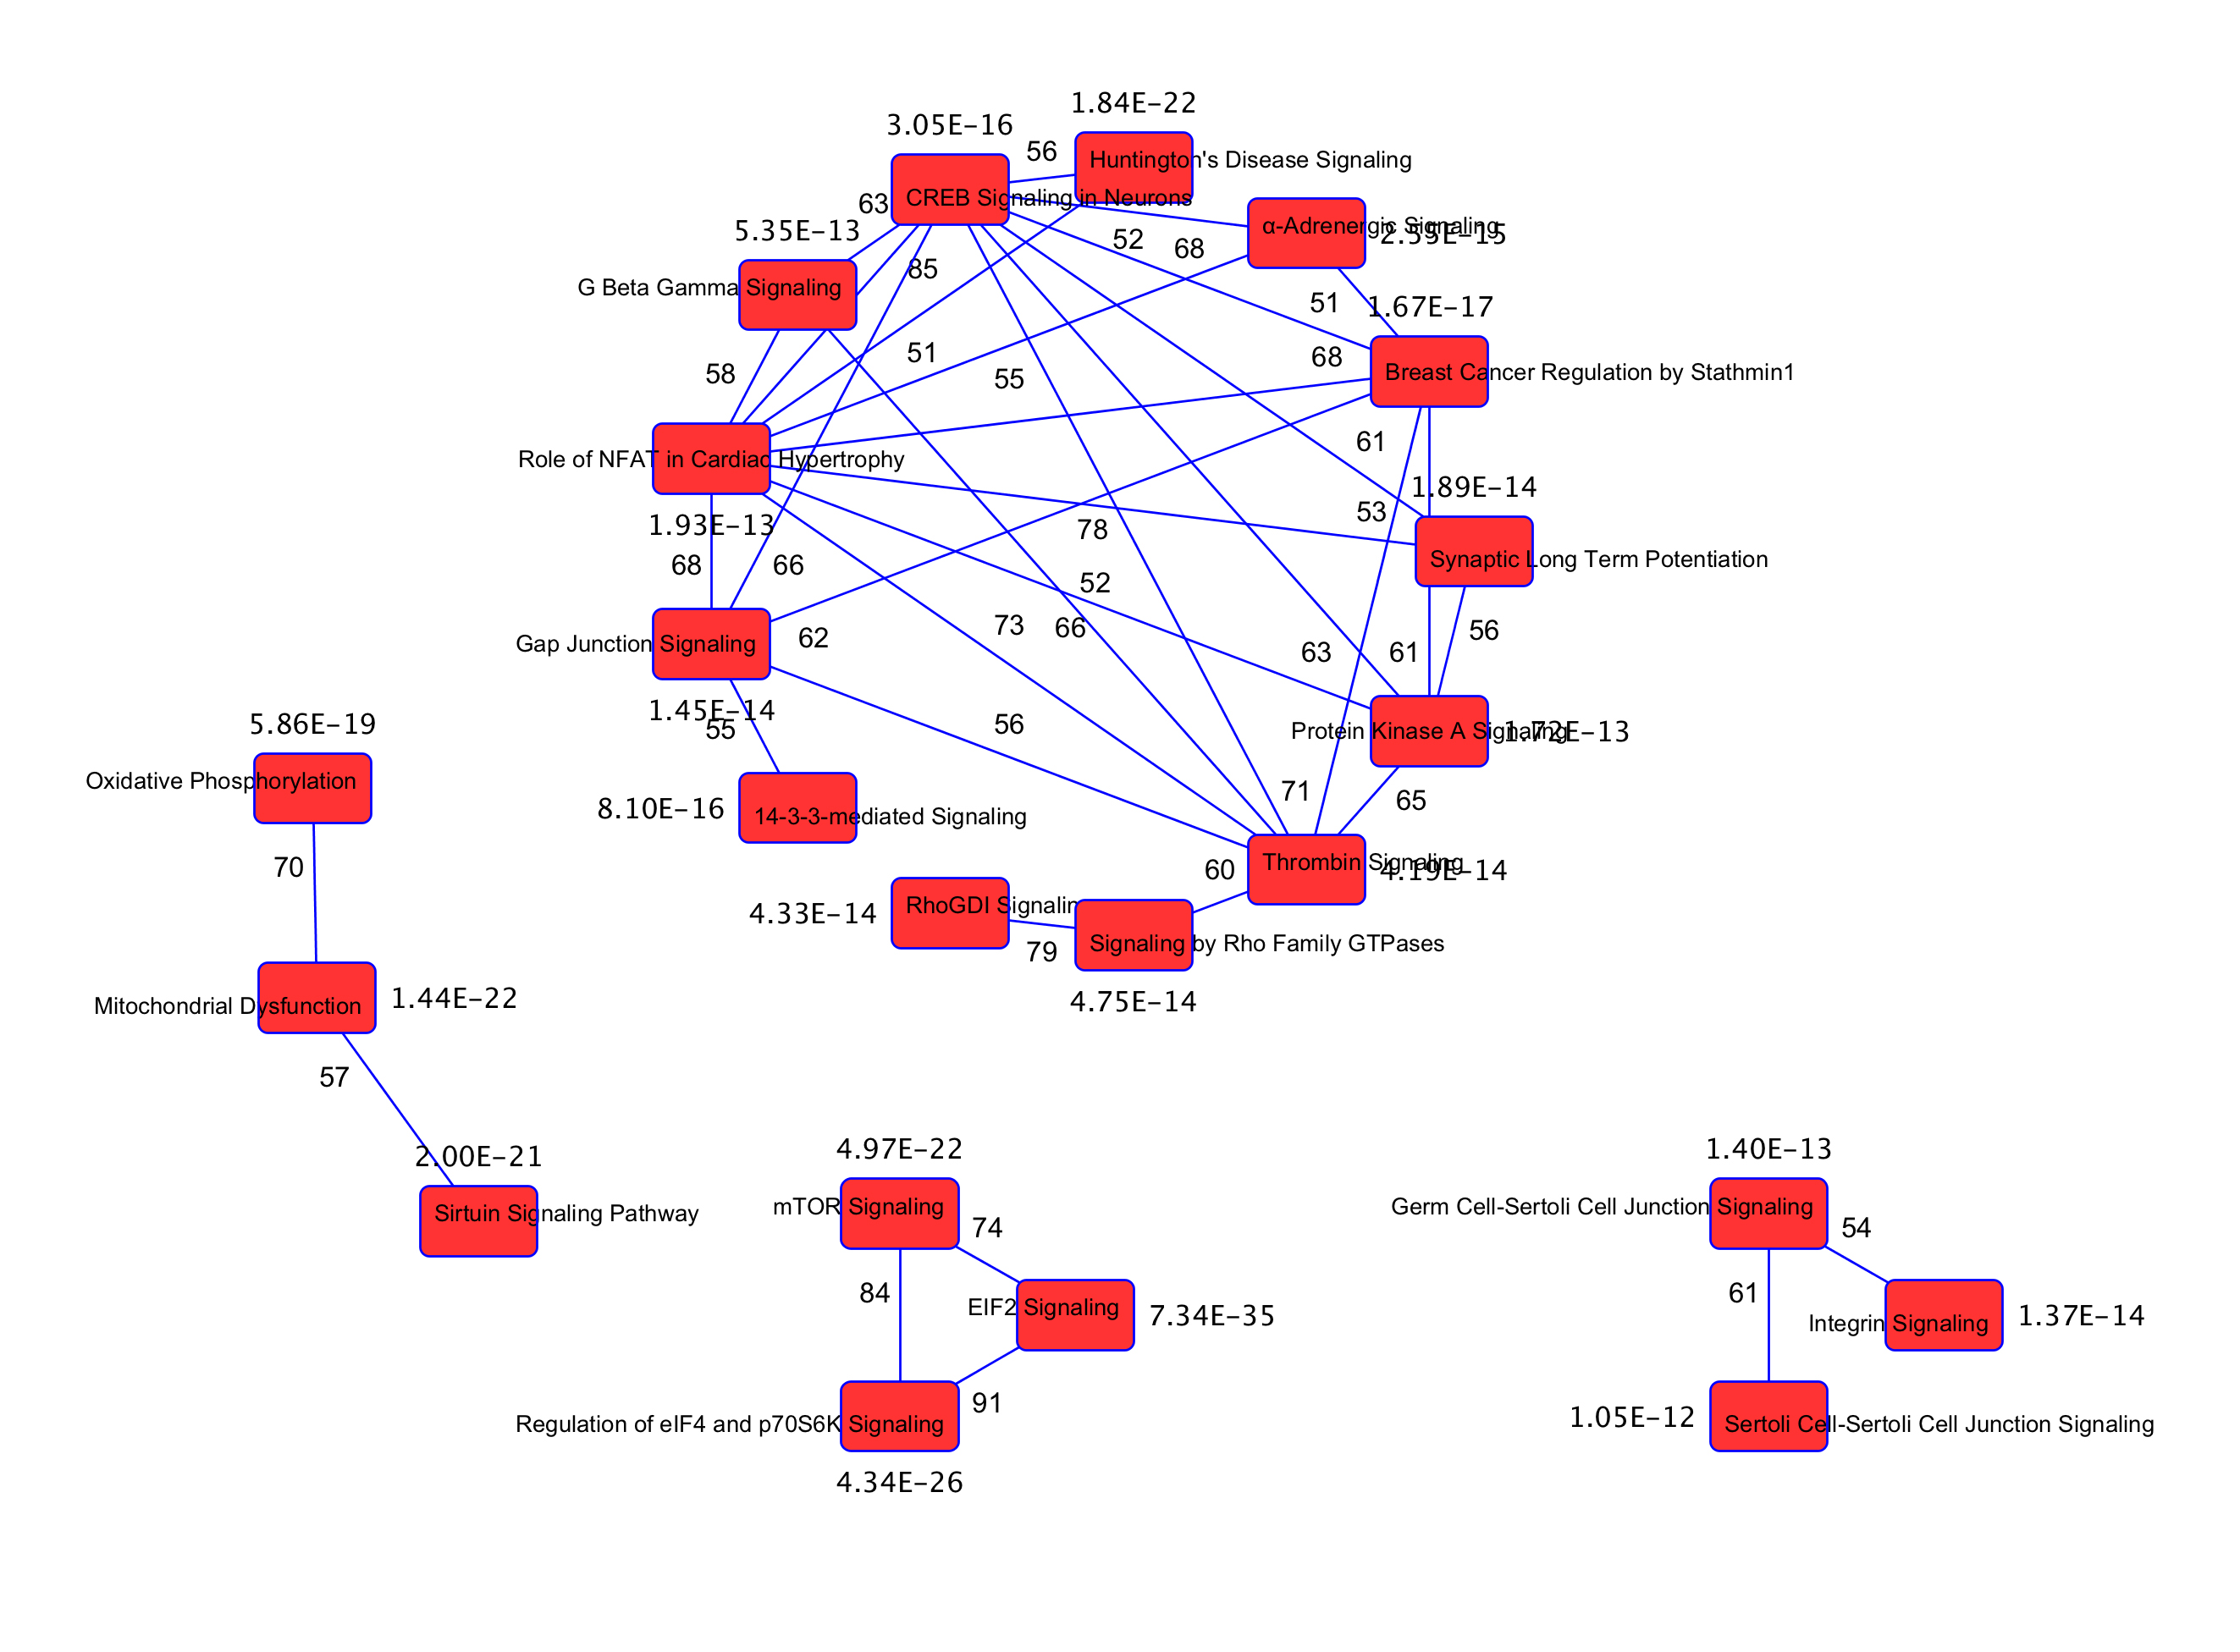
 Figure 5 of
Harman, Mol Vis 2018; 24:875-889.
Figure 5 of
Harman, Mol Vis 2018; 24:875-889.