Figure 9. Variation from idealized circumferential angle distribution (with respect to the nerve canal edge) of the polar vector plots
from the peripapillary sclera. The averaged control (A) is shown alongside the three highly myopic specimens HM1 (B), HM2 (C), and HM3 (D) following the orientation of a right eye viewed from the back: Top, superior; Left, nasal; Bottom, inferior; Right, temporal.
Marked deviations from circumferential alignment show up as hot-spots in the myopic maps.
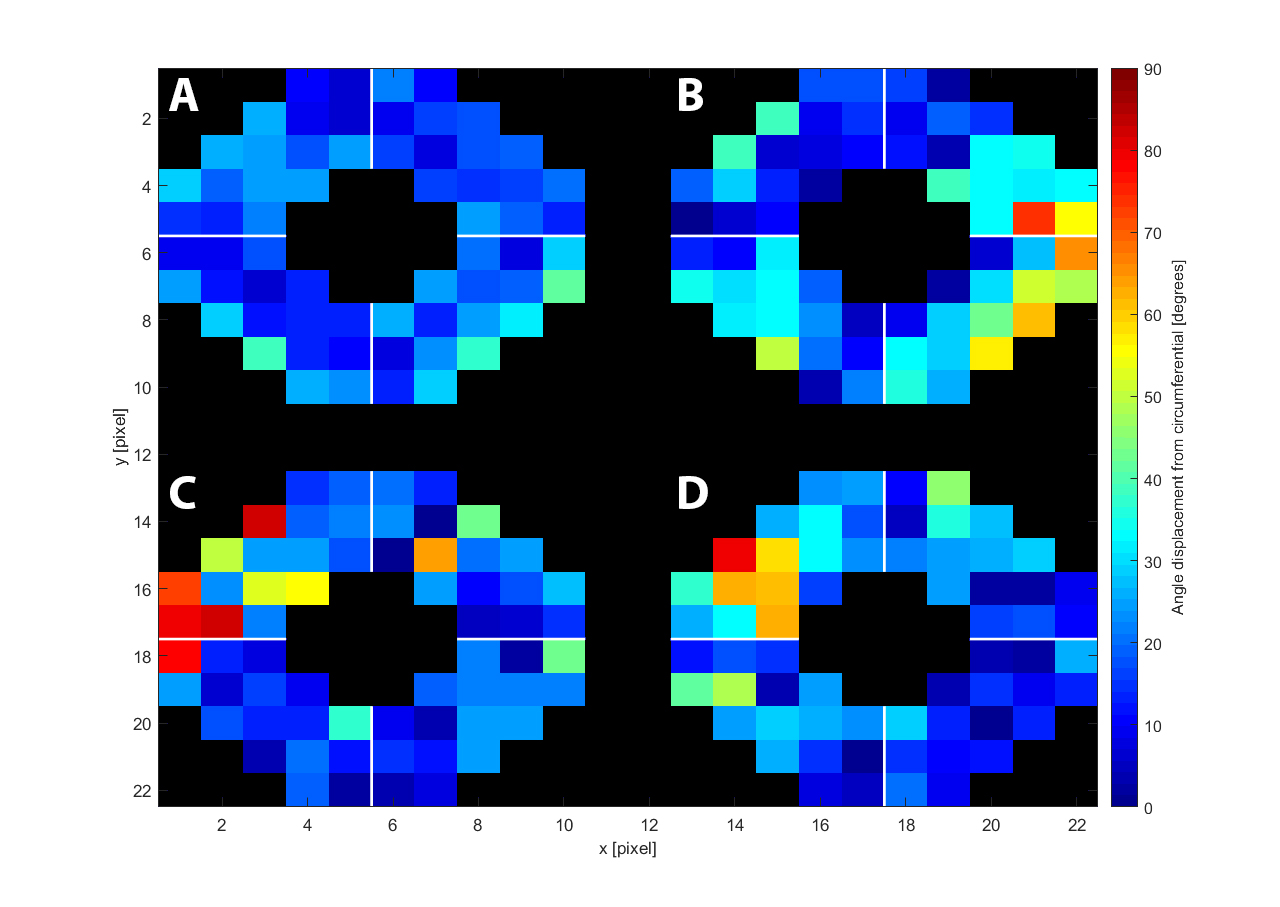
 Figure 9 of
Markov, Mol Vis 2018; 24:818-833.
Figure 9 of
Markov, Mol Vis 2018; 24:818-833.