Figure 8. Group-wise statistical comparison of the mean (A) collagen anisotropic proportion and (B) the fiber angle deviation from circumferential in the whole peripapillary sclera using linear mixed-model analysis. The
asterisk denotes statistical significance at the p<0.05 level.
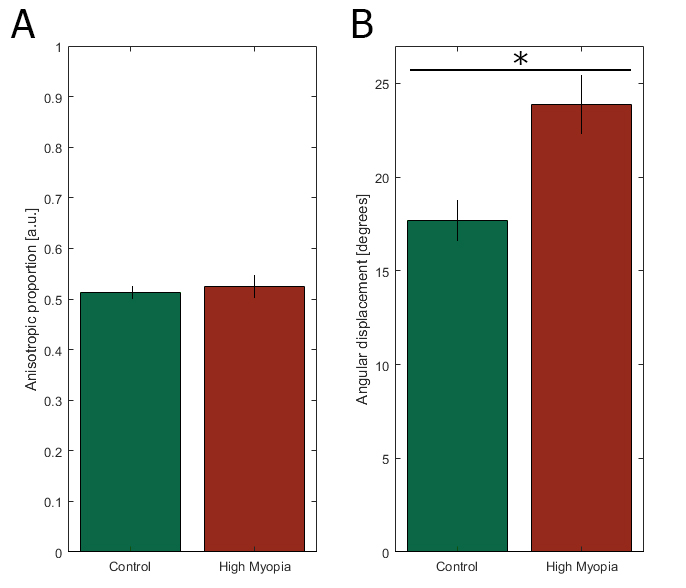
 Figure 8 of
Markov, Mol Vis 2018; 24:818-833.
Figure 8 of
Markov, Mol Vis 2018; 24:818-833.