Figure 5. WAXS polar plot vector maps comparing one non-myopic (A–B) and two highly myopic (C–F) posterior scleras. A: Full map of non-myopic specimen N4. B: 30 × 30 vector plot zoom of N4. C: Full map of highly myopic specimen HM1. D: 30 × 30 vector plot zoom of HM1. E: Full map of highly myopic specimen HM2. F: 30 × 30 vector plot zoom of HM2. G: Map of myopic specimen HM3. The zoomed regions are denoted by a red square on the full maps. The peripapillary scleral region
is shown bounded by black lines, in which largely circumferential collagen alignment is observed. Arrows: interruption of
the circumferential collagen orientation (normally limited to the SN quadrant in non-myopic eyes) is more extensive in highly
myopic specimens. S, N, I, and T denote the superior, nasal, inferior, and temporal directions, respectively.
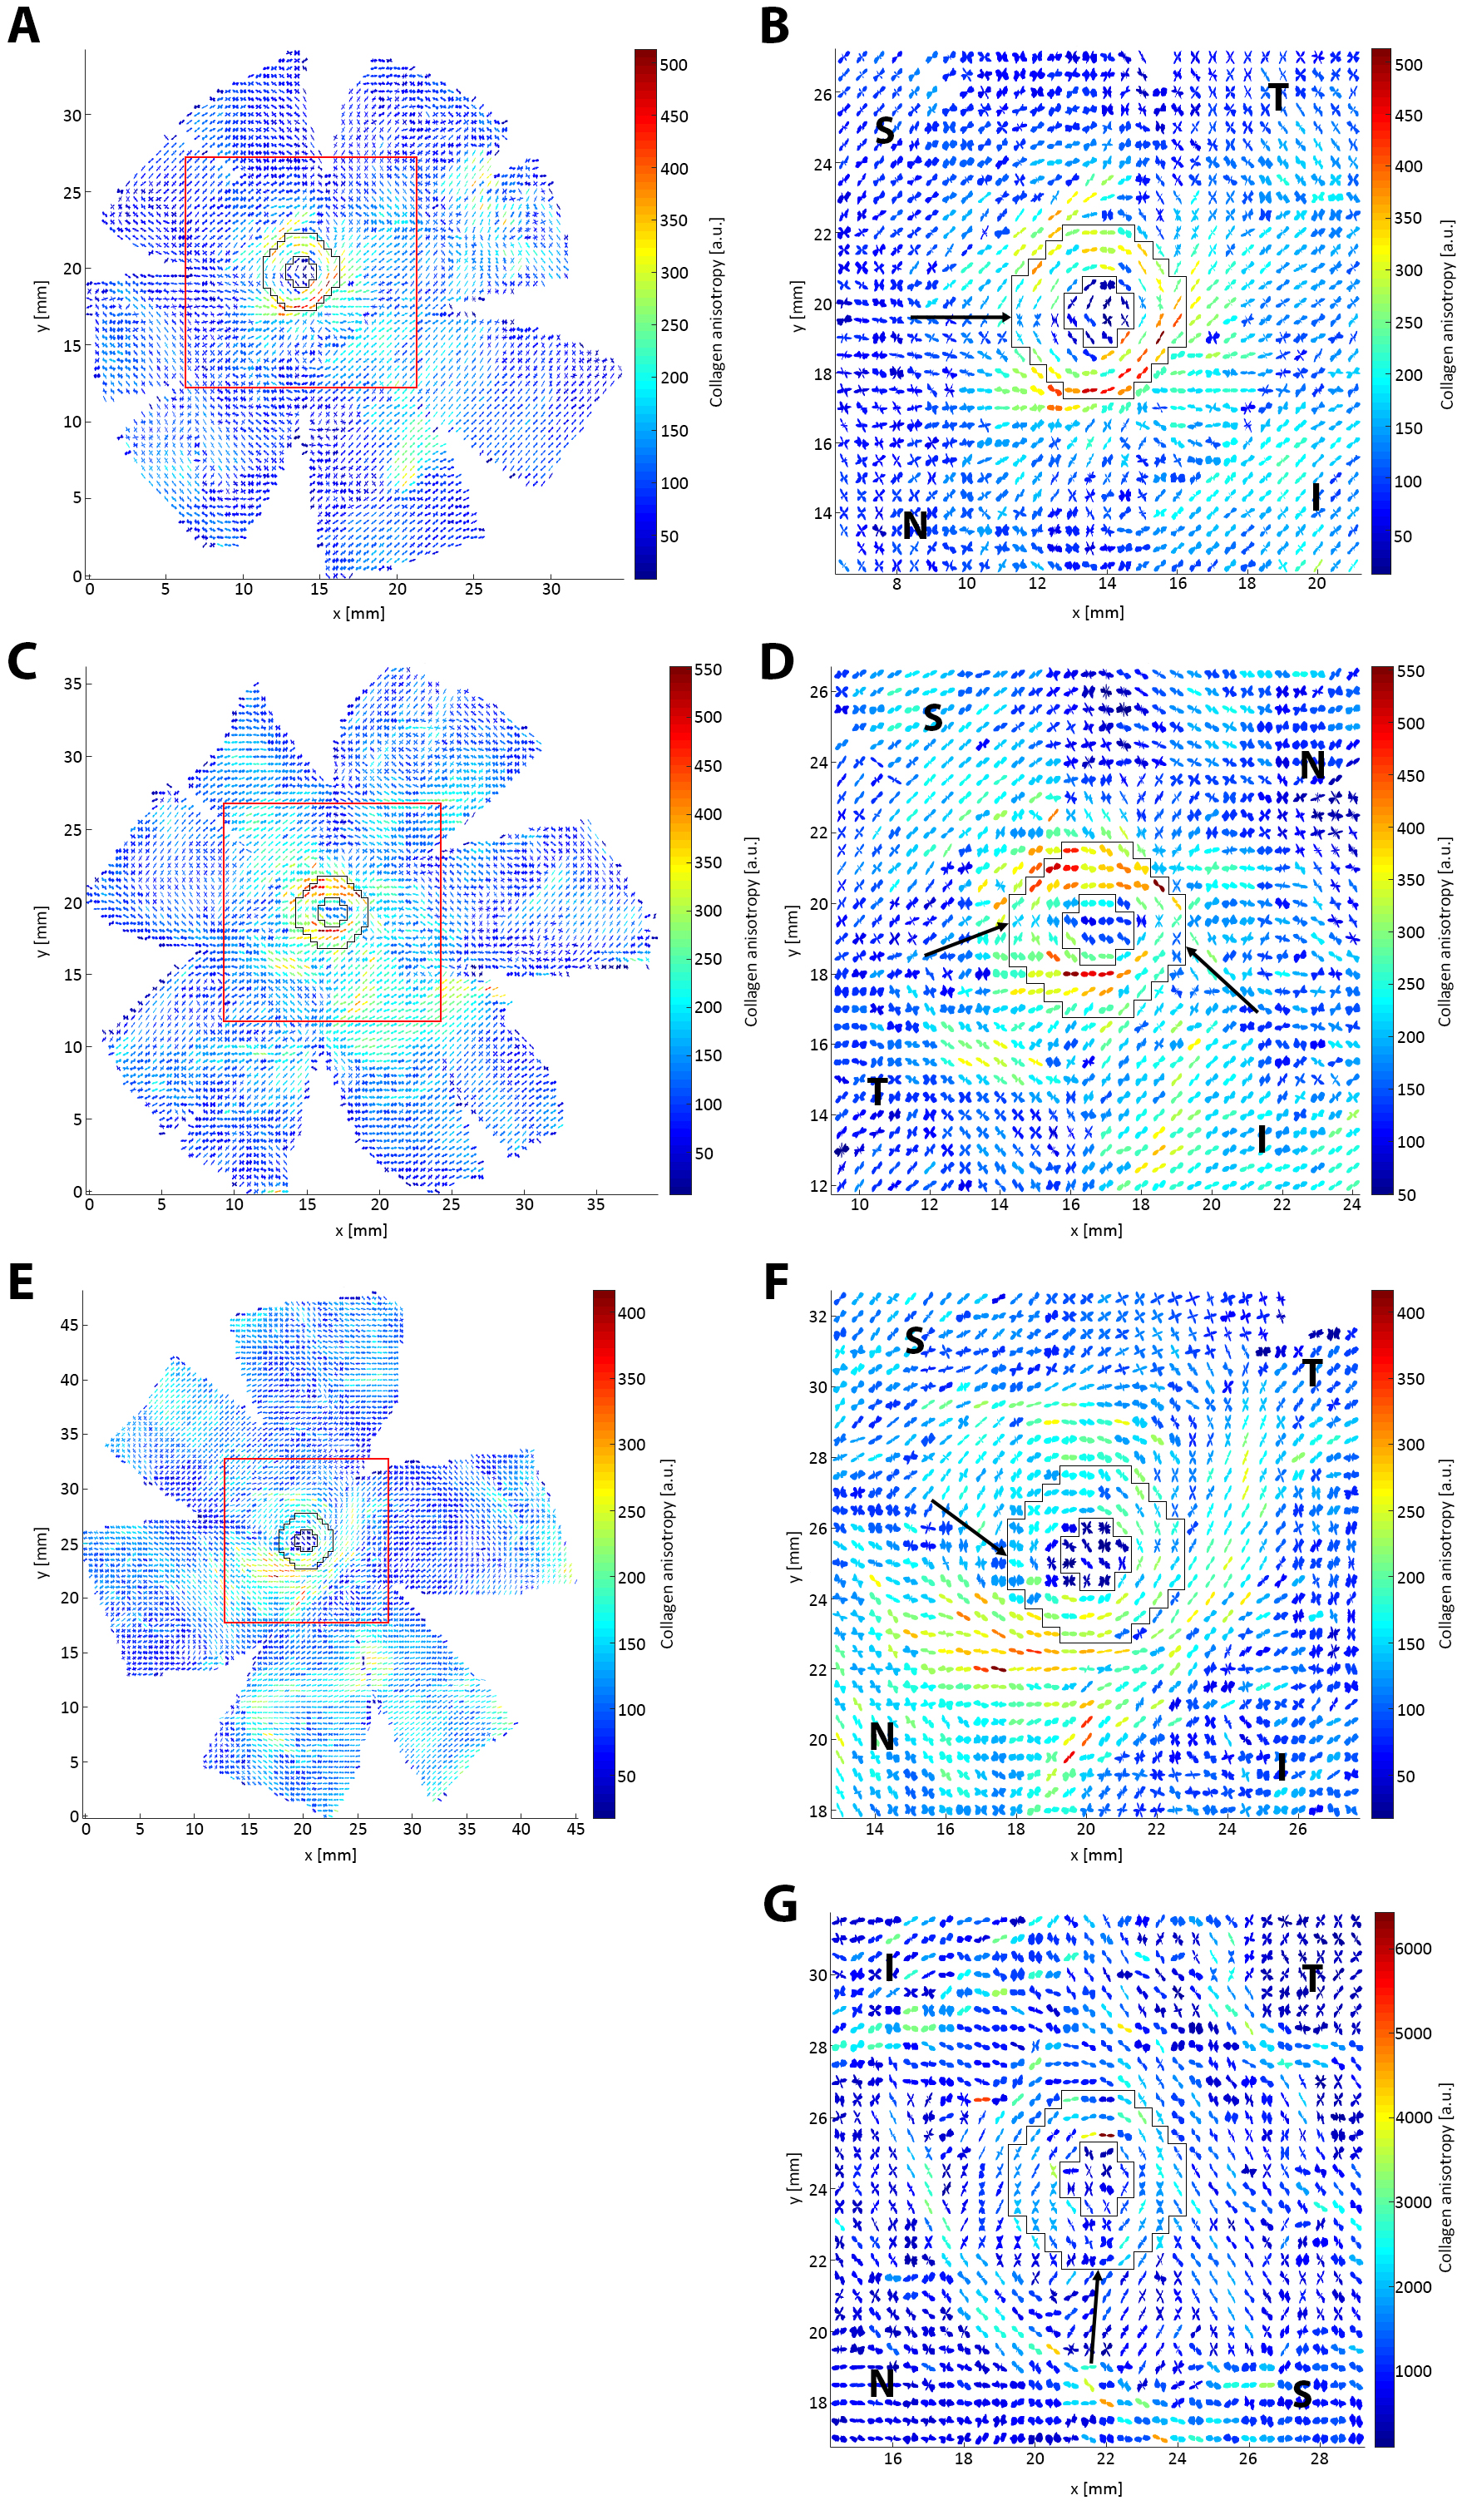
 Figure 5 of
Markov, Mol Vis 2018; 24:818-833.
Figure 5 of
Markov, Mol Vis 2018; 24:818-833.