Figure 3. X-ray scattering data analysis. A: Wide-angle X-ray scattering (WAXS) pattern from peripapillary human sclera N4. The area bounded by the two concentric circles
corresponds to the collagen scatter. The X-ray scatter intensity spread as a function of the azimuth angle ϕ around the collagen
peak can be analyzed, which provides the distribution of the fibril orientations. The presented two-lobed WAXS pattern is
indicative of the uniaxial fiber alignment at that point in the tissue. B: Power-law background function (green line) fitted to a radial intensity profile (red line) through the pattern shown in
(A). The blue open circle marks the peak in collagen intensity, while the blue crosses show the fitting points of the background
function. For each WAXS pattern, a background function was independently fitted along the 720 equally spaced radial directions,
which allows extraction of the collagen signal in two dimensions. C: Angular X-ray scatter intensity profile for the pattern presented in (A). The collagen scatter intensity may be represented as two components: scatter from the isotropically aligned collagen fibrils
(Ii) and anisotropic scatter (Ia) arising from preferentially aligned collagen. D: Corresponding polar vector plot of the collagen alignment. The anisotropic collagen scatter is displayed in polar coordinates,
where the length of vector r is proportional to the relative number of collagen fibrils oriented along the preferred direction.
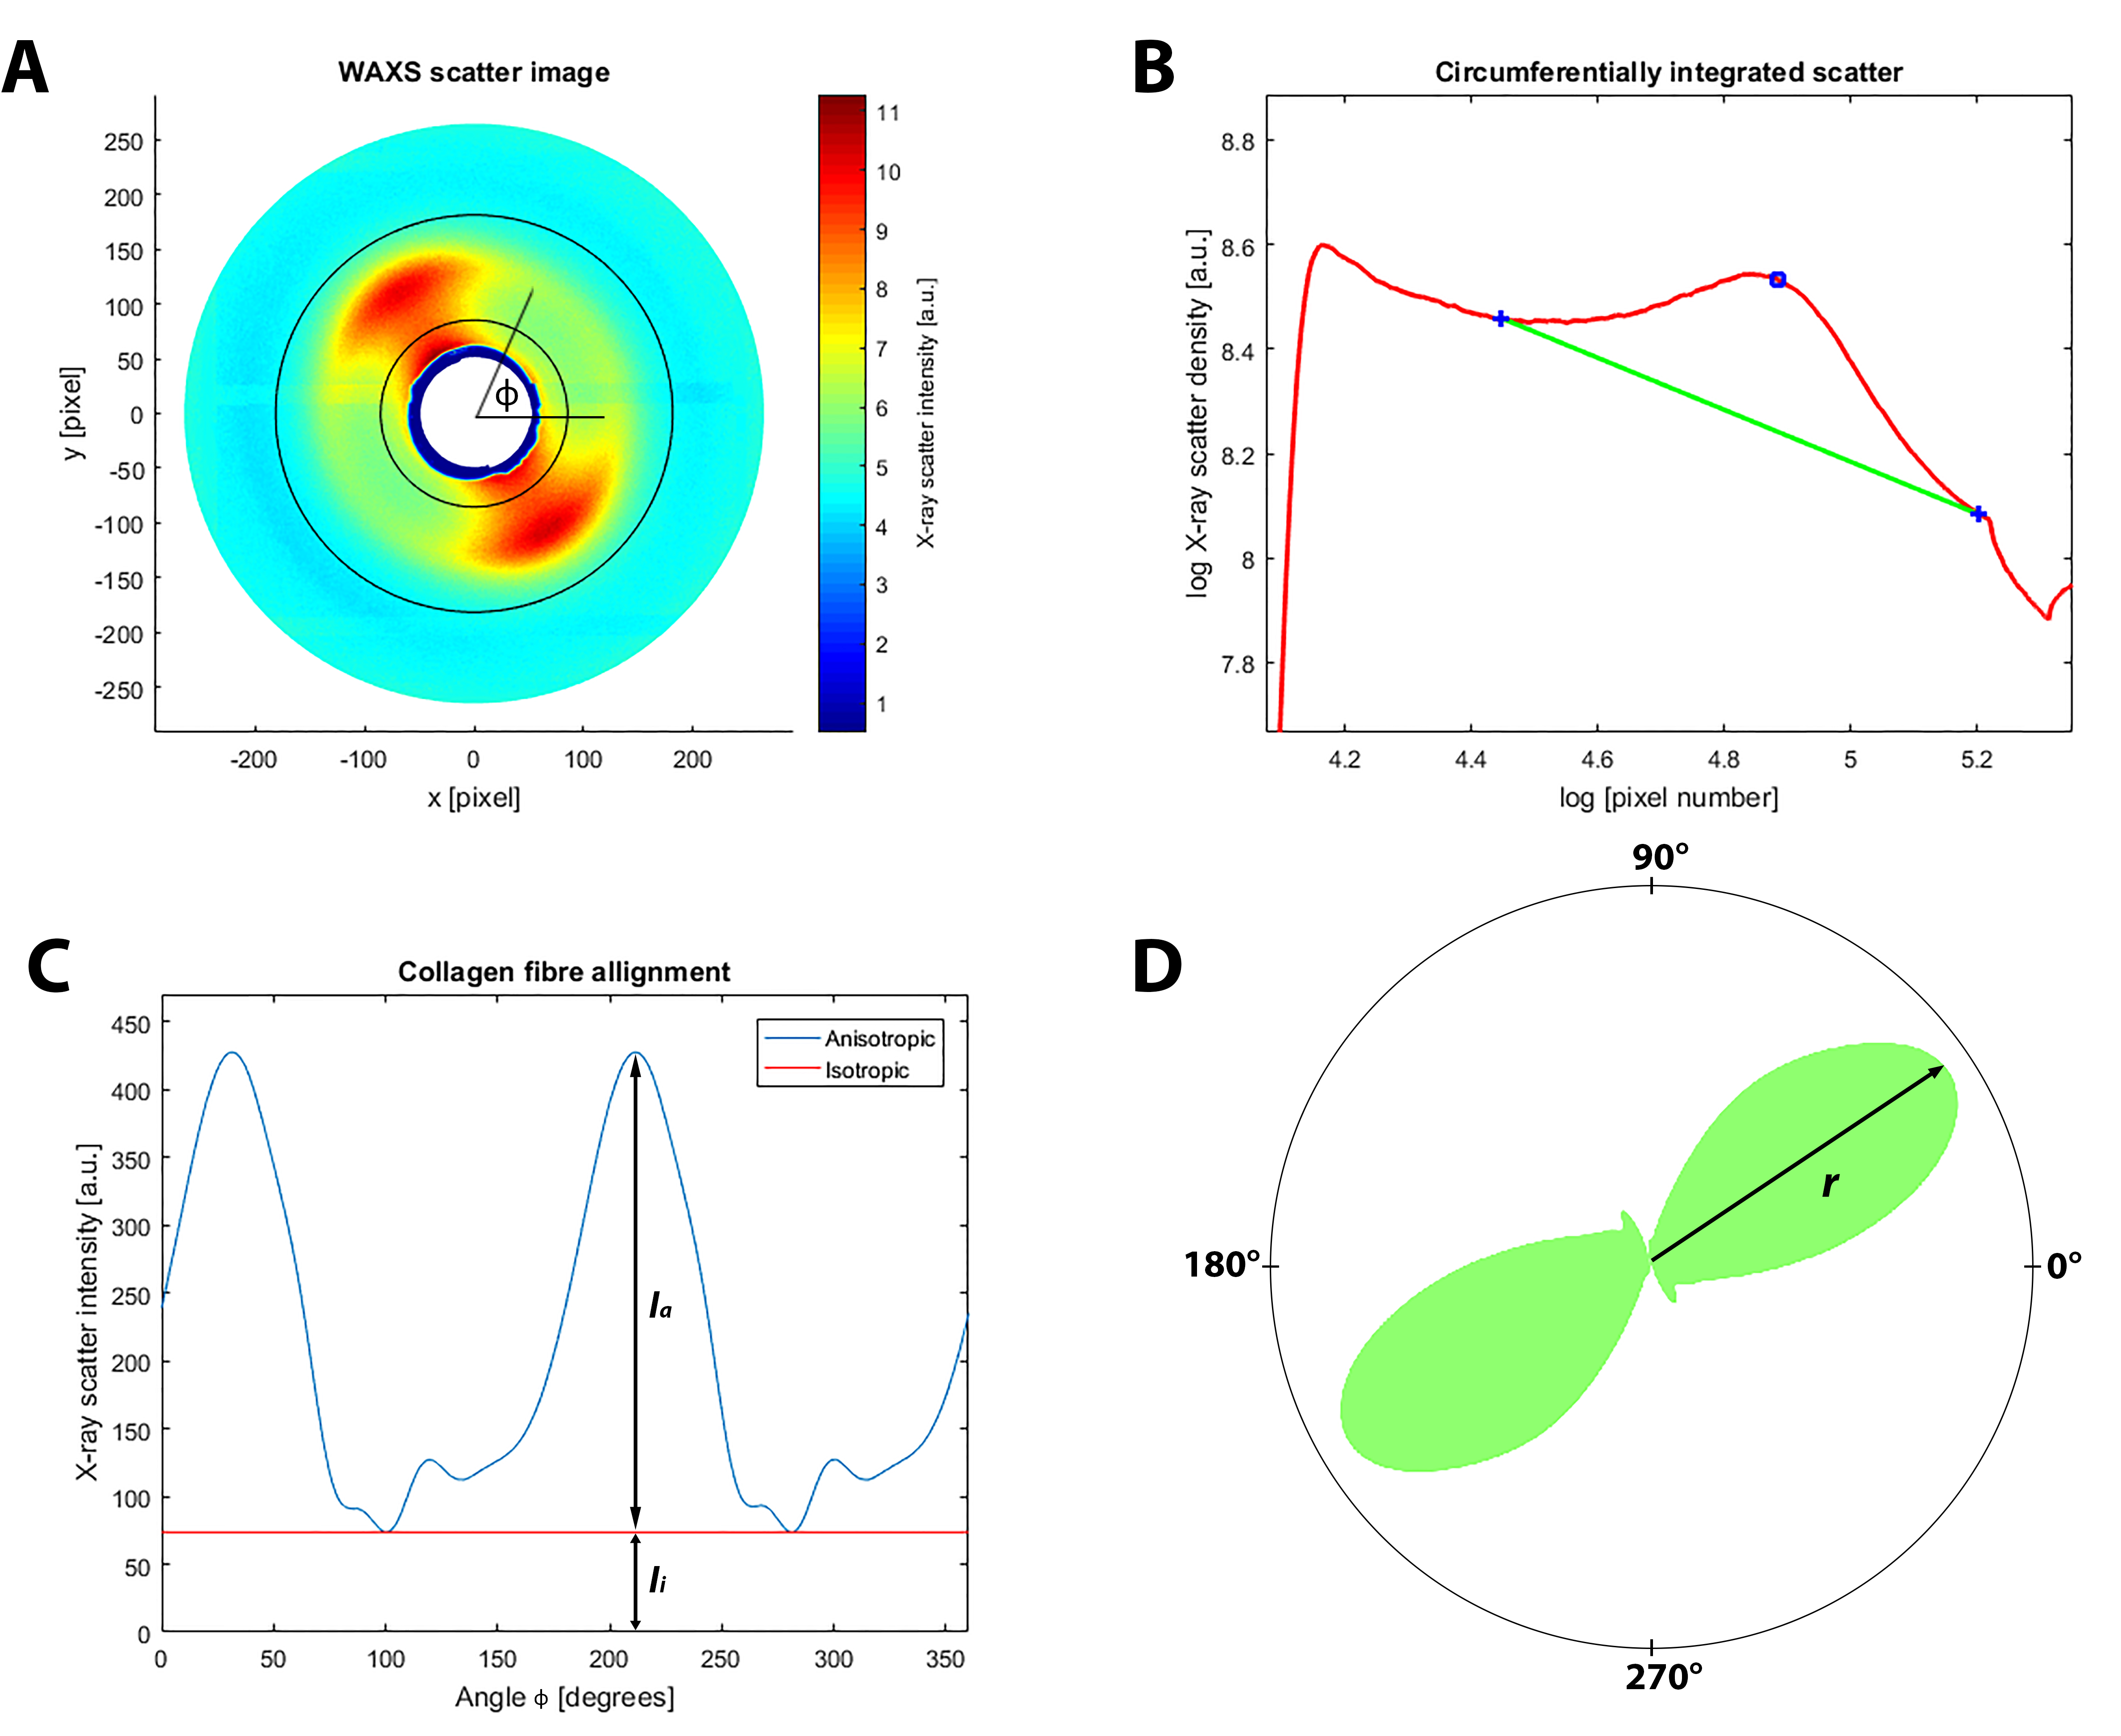
 Figure 3 of
Markov, Mol Vis 2018; 24:818-833.
Figure 3 of
Markov, Mol Vis 2018; 24:818-833.