Figure 10. Box plots of mean collagen fiber deviation from circumferential orientation in the peripapillary sclera by quadrant for the
non-myopic control group (SN: superior-nasal, ST: superior-temporal, IT: inferior-temporal, IN: inferior-nasal). Specimen-specific
corresponding values for highly myopic specimens HM1, HM2, and HM3 are shown for comparison and denoted by circles, asterisks,
and triangles, respectively. Note that the majority of the myopic data lie outside the non-myopic range.
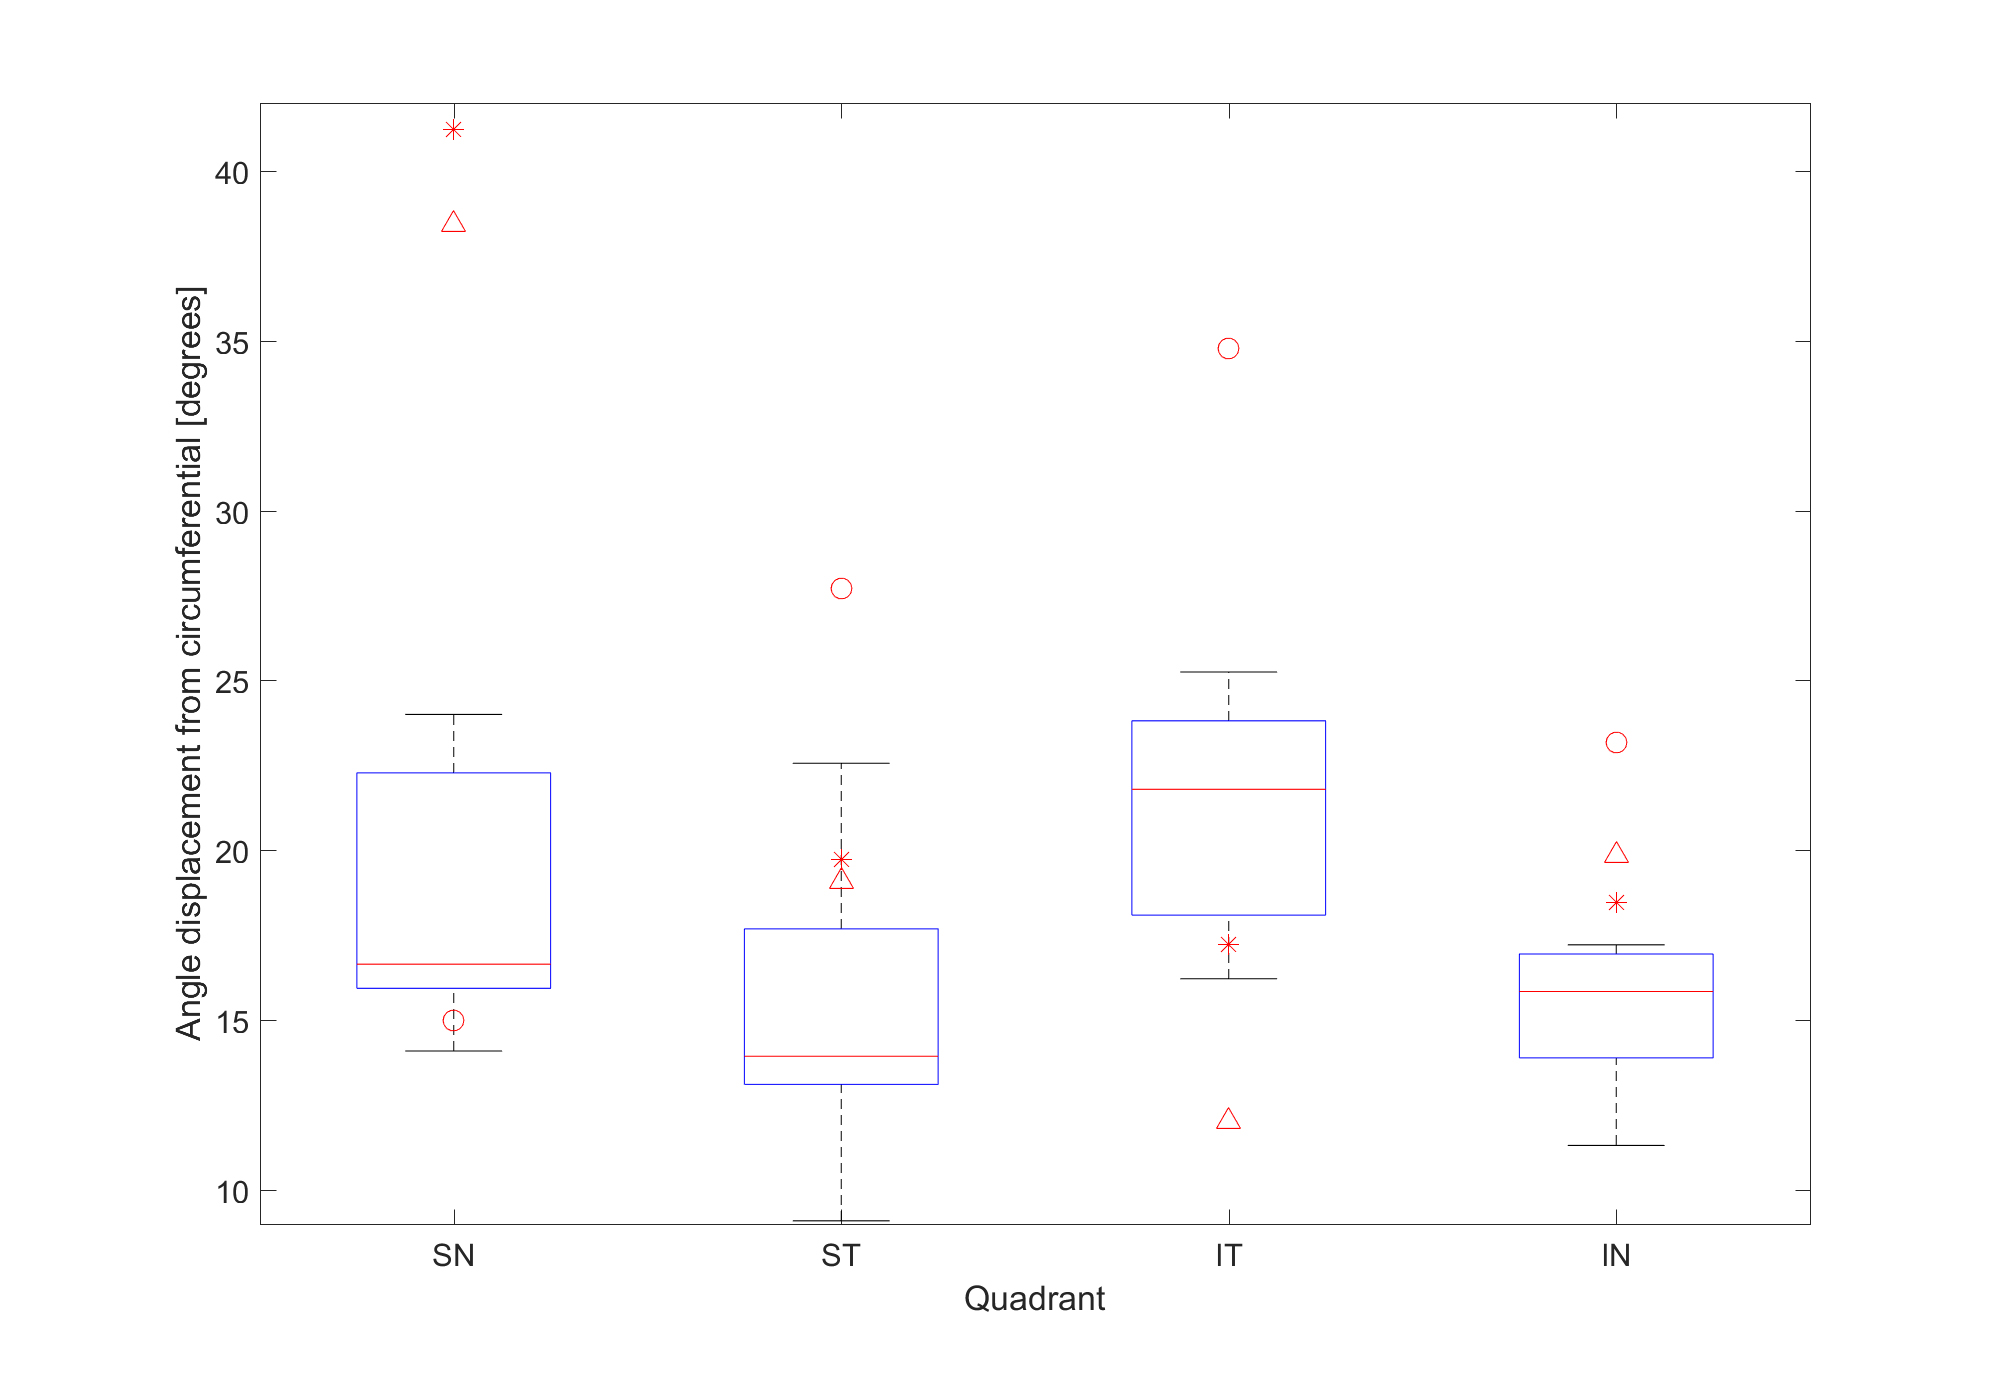
 Figure 10 of
Markov, Mol Vis 2018; 24:818-833.
Figure 10 of
Markov, Mol Vis 2018; 24:818-833.