Figure 4. Molecular relationships of proteins identified in PEX material in this study and genes and proteins previously implicated
in PEX syndrome. The top sub-network or module consisting of 46 nodes and 87 edges revealed with network analysis in InnateDB
is shown. Genes and proteins implicated in pseudoexfoliation (PEX) syndrome are in red; solid line = protein–protein interaction;
dashed line = unspecified association; double lines = colocalization.
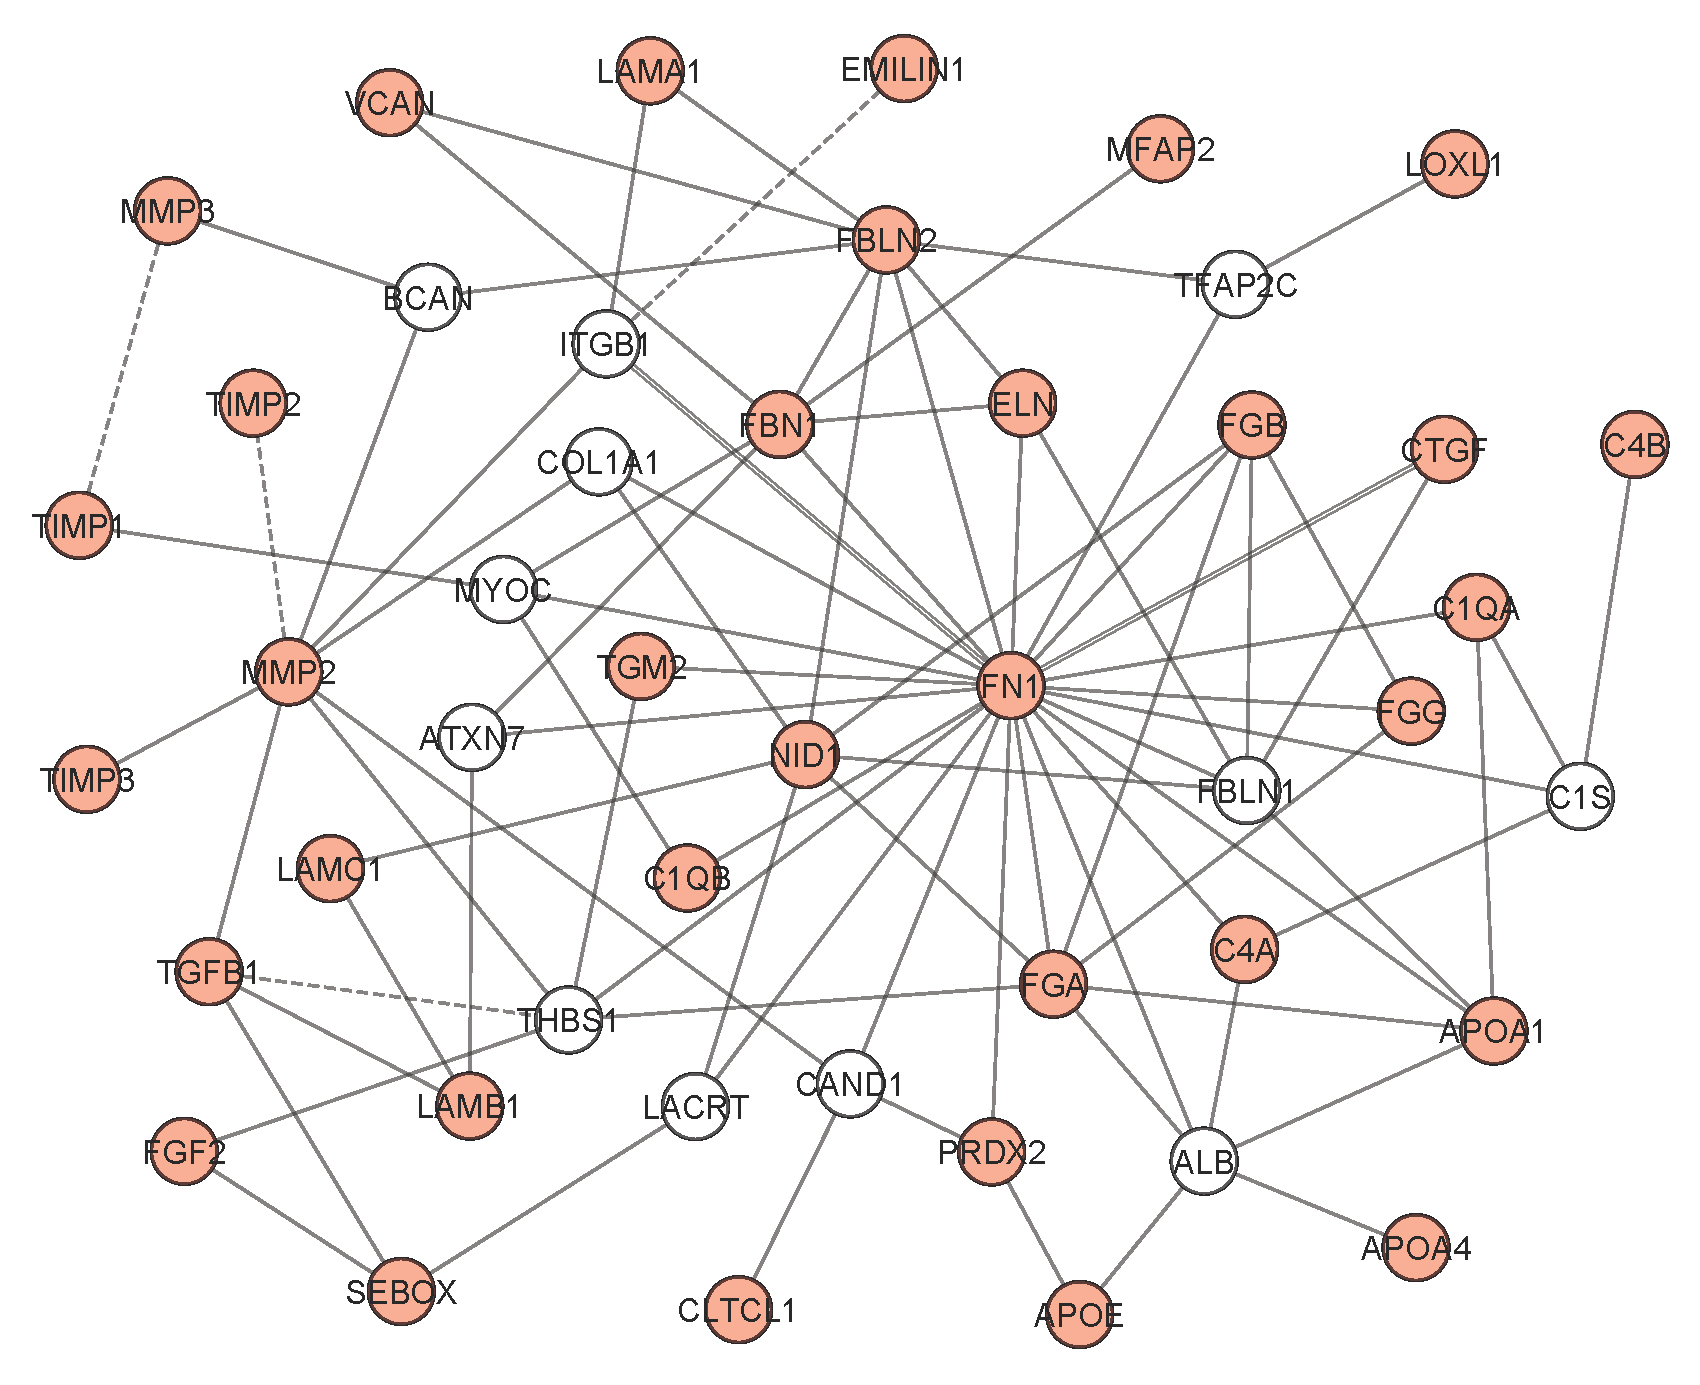
 Figure 4 of
Sharma, Mol Vis 2018; 24:801-817.
Figure 4 of
Sharma, Mol Vis 2018; 24:801-817.