Figure 7. Bland Altman plot of A3ID versus the gold standard. The difference between manual and A3ID avascular area measurements for
each of the 10 retinal flat mount images is plotted against the average avascular area of all reads (manual and A3ID) for
each image. The positive slope of the line of best fit for this data indicates that A3ID underestimates avascular area in
retinal images with low avascular area and overestimates the avascular area in retinal images with large avascular areas.
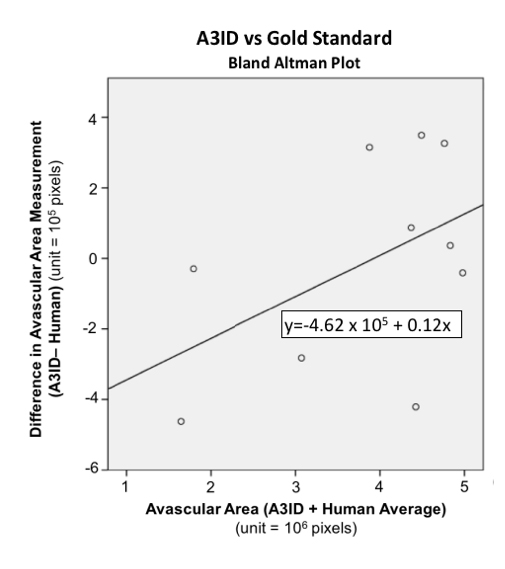
 Figure 7 of
Simmons, Mol Vis 2018; 24:767-777.
Figure 7 of
Simmons, Mol Vis 2018; 24:767-777.