Figure 2. Total peripheral avascular area algorithm identification image processing steps. The input for A3ID is a single image of a
lectin-stained retinal flat mount from the OIR rat model (A). We used four small selections from the gold standard data set (B) to train the Weka Segmentation Tool to segment images into vascular, avascular retina, and background categories (C). We then used the Shape Filter plugin to distinguish the avascular area from inter-vascular spaces (D) (the rainbow coloring is a product of the IJBlob Shape Filter algorithm and merely indicates the sequence of analysis.)
After two post-processing quality steps, the final output is the retinal avascular area (E).
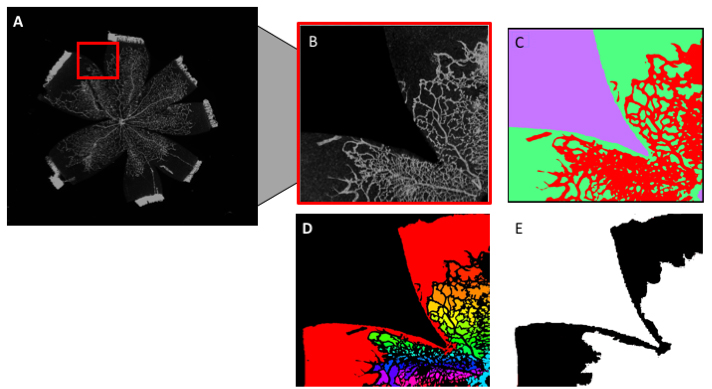
 Figure 2 of
Simmons, Mol Vis 2018; 24:767-777.
Figure 2 of
Simmons, Mol Vis 2018; 24:767-777.