Figure 5. Difference in MDA levels and SOD, GSH-Px, and CAT activities in the retina 24 h after I/R. A: Malondialdehyde (MDA) levels in the ischemia/reperfusion (I/R) plus vehicle group and the I/R plus echinacoside (ECH) group
became statistically significantly higher than those of the sham group and the sham plus ECH group (p<0.05). The MDA level
in the I/R plus ECH group was higher than that of the sham group but was statistically significantly lower than that of the
I/R plus vehicle group (p<0.05). B–D: The superoxide dismutase (SOD), catalase (CAT), and glutathione peroxidase (GSH-Px) activity in the I/R plus vehicle group
and the I/R plus ECH group became statistically significantly lower than that of the sham group (p<0.05). The activities in
the sham group plus ECH group were statistically significantly higher than those in the I/R plus vehicle group (p<0.05). *p<0.05
versus the sham group; #p<0.05 versus the I/R plus vehicle group.
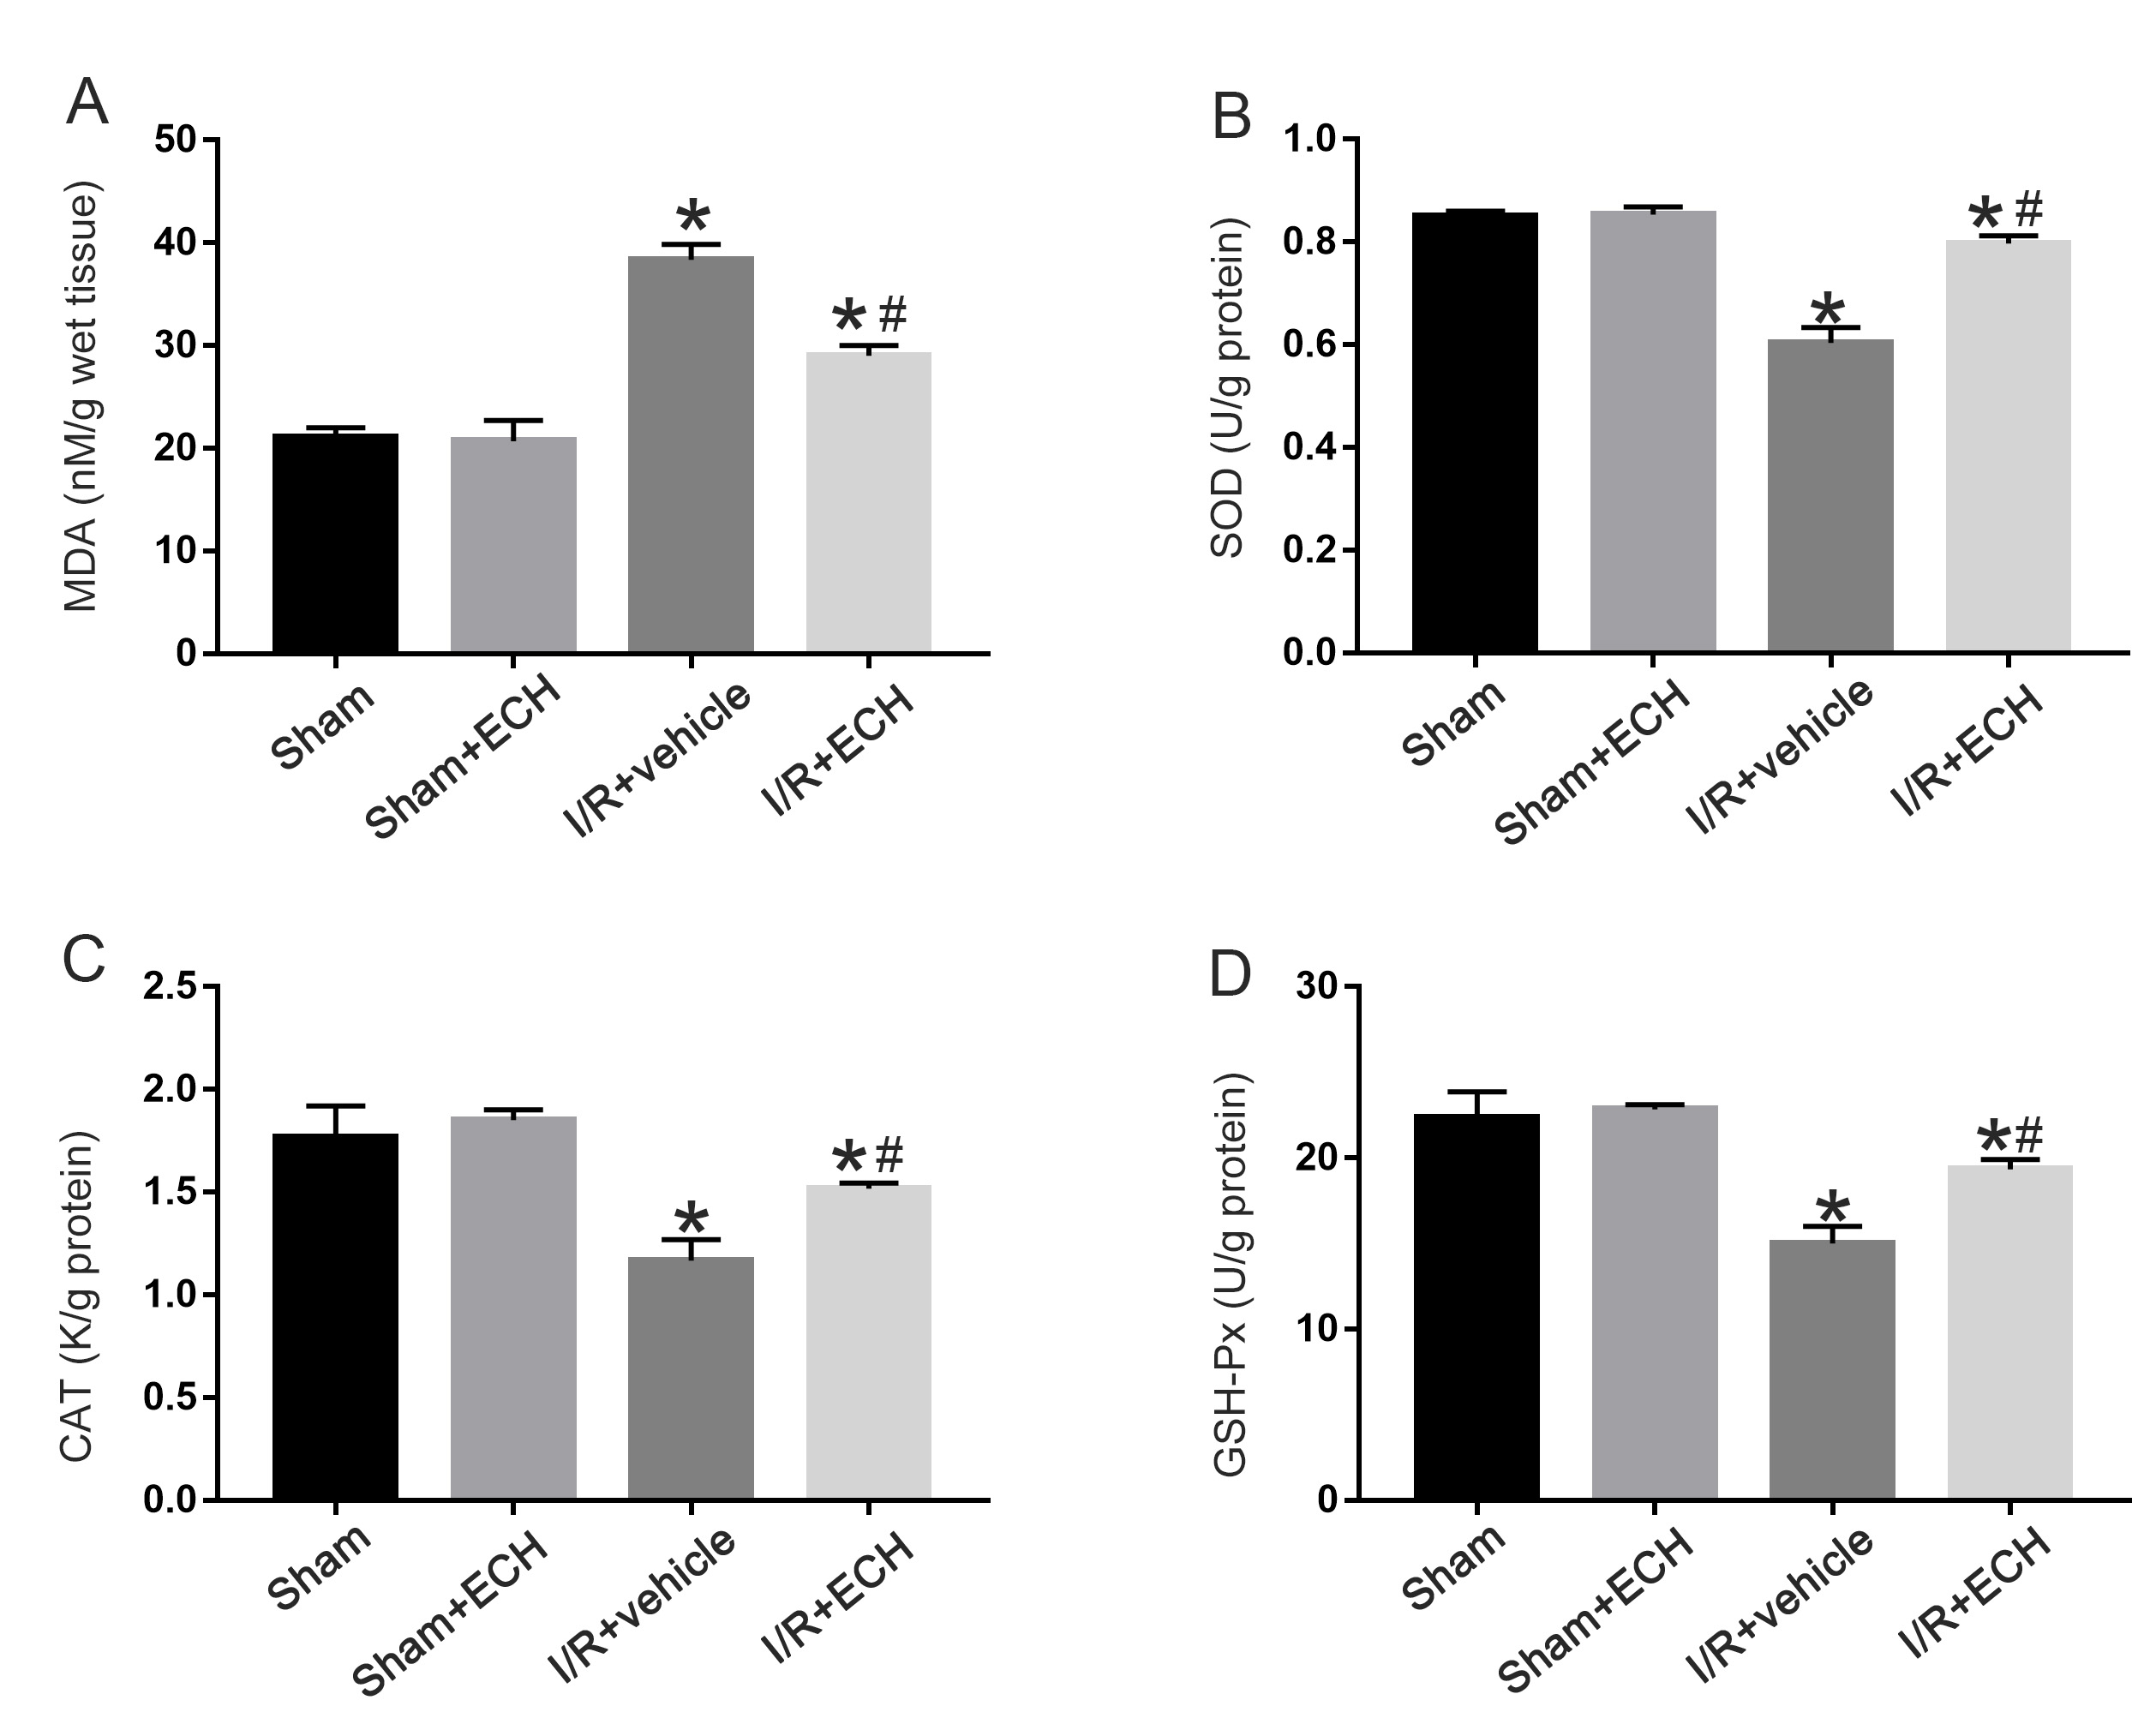
 Figure 5 of
Li, Mol Vis 2018; 24:746-758.
Figure 5 of
Li, Mol Vis 2018; 24:746-758.