Figure 4. Histological comparison of optic nerves in 4 groups after I/R. A, B: Optic nerves show tightly packed myelinated axons and thin septae from the sham group and the sham plus echinacoside (ECH)
group. C: Optic nerves from vehicle-treated animals show disruption of the axon fascicles, severe axonal loss (thin arrow), and increases
in connective tissue septa (big arrow). D: In the ischemia/reperfusion (I/R) plus ECH group, the preservation of the retinal ganglion cell (RGC) axons was better than
in vehicle control, although with a relative increase in the septal connective tissue. Scale bar: 200 μm. Electron micrographs
of transverse sections of optic nerves from the sham group, the I/R plus vehicle group, and the I/R plus ECH group post-insult.
E, F: Optic nerves show an orderly arrangement of the myelin sheath in the axons in the sham group and the I/R plus ECH group.
G: In the I/R plus vehicle group, myelinated nerve fibers are scarce and irregularly arranged, with distinct axonal damage,
seen as swollen, collapsed axons (thin arrow), condensed electron opaque axoplasm (big arrow). H: In the I/R plus ECH group, ECH attenuated axon damage, although some condensed electron opaque axoplasm and detachment of
the myelin lamellae from the cytoplasmic membrane are also observed. Scale bar: 4 μm. I: The bar graph represents the total number of axons in all groups. There was a statistically significant loss, approximately
a 39.31% reduction in the number of axons in the I/R plus vehicle group with respect to the sham group (*p<0.05), and there
was an approximately 25.47% reduction in the number of axons in the I/R plus vehicle group compared with the I/R plus ECH
group (#p<0.05).
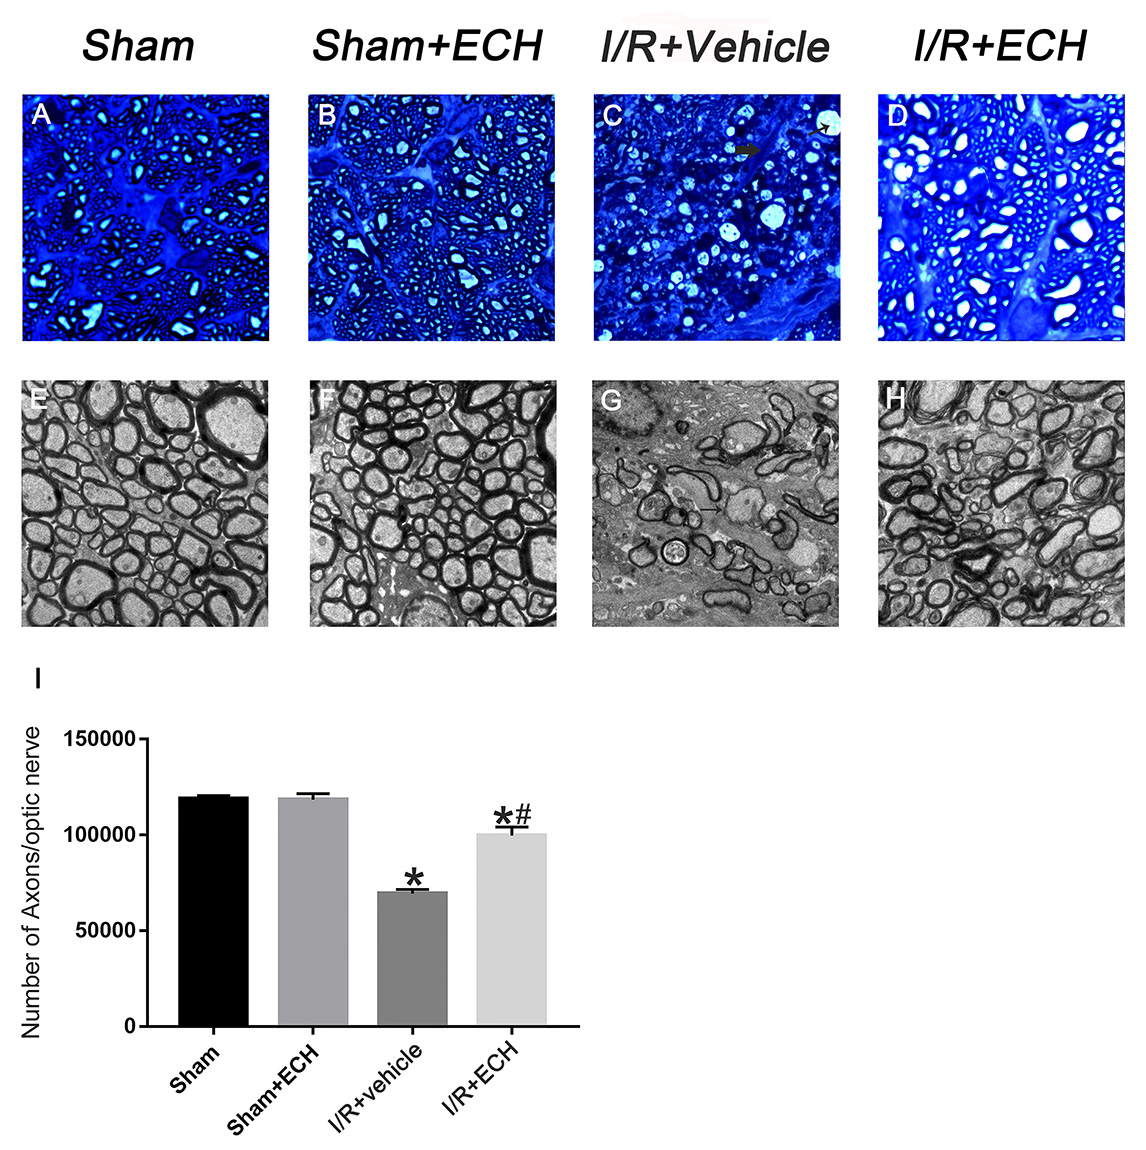
 Figure 4 of
Li, Mol Vis 2018; 24:746-758.
Figure 4 of
Li, Mol Vis 2018; 24:746-758.