Figure 2. Comparison of RGCs in four treated groups. A, B: Most retinal ganglion cells (RGCs) stained Fluoro-Gold (FG)-positive 7 days in the sham group and the sham plus echinacoside
(ECH) group. C: Many RGCs died, and activated microglia cells stained FG-positive after phagocytosis in the retinas of the rats that received
vehicle at 7 days after the ischemia/reperfusion (I/R) injury. D: In the retinas of the I/R plus ECH group, there were more RGCs stained FG-positive than in the retinas in the I/R plus vehicle
group. *p<0.05 versus sham group; #p<0.05 versus I/R plus vehicle group. E: The bar graph represents the total number of RGCs in all groups. There was a statistically significant loss, an approximate
31.11% reduction in the number of RGCs in the I/R plus vehicle group with respect to the I/R plus ECH group. Scale bar: 100
μm. *p<0.05.
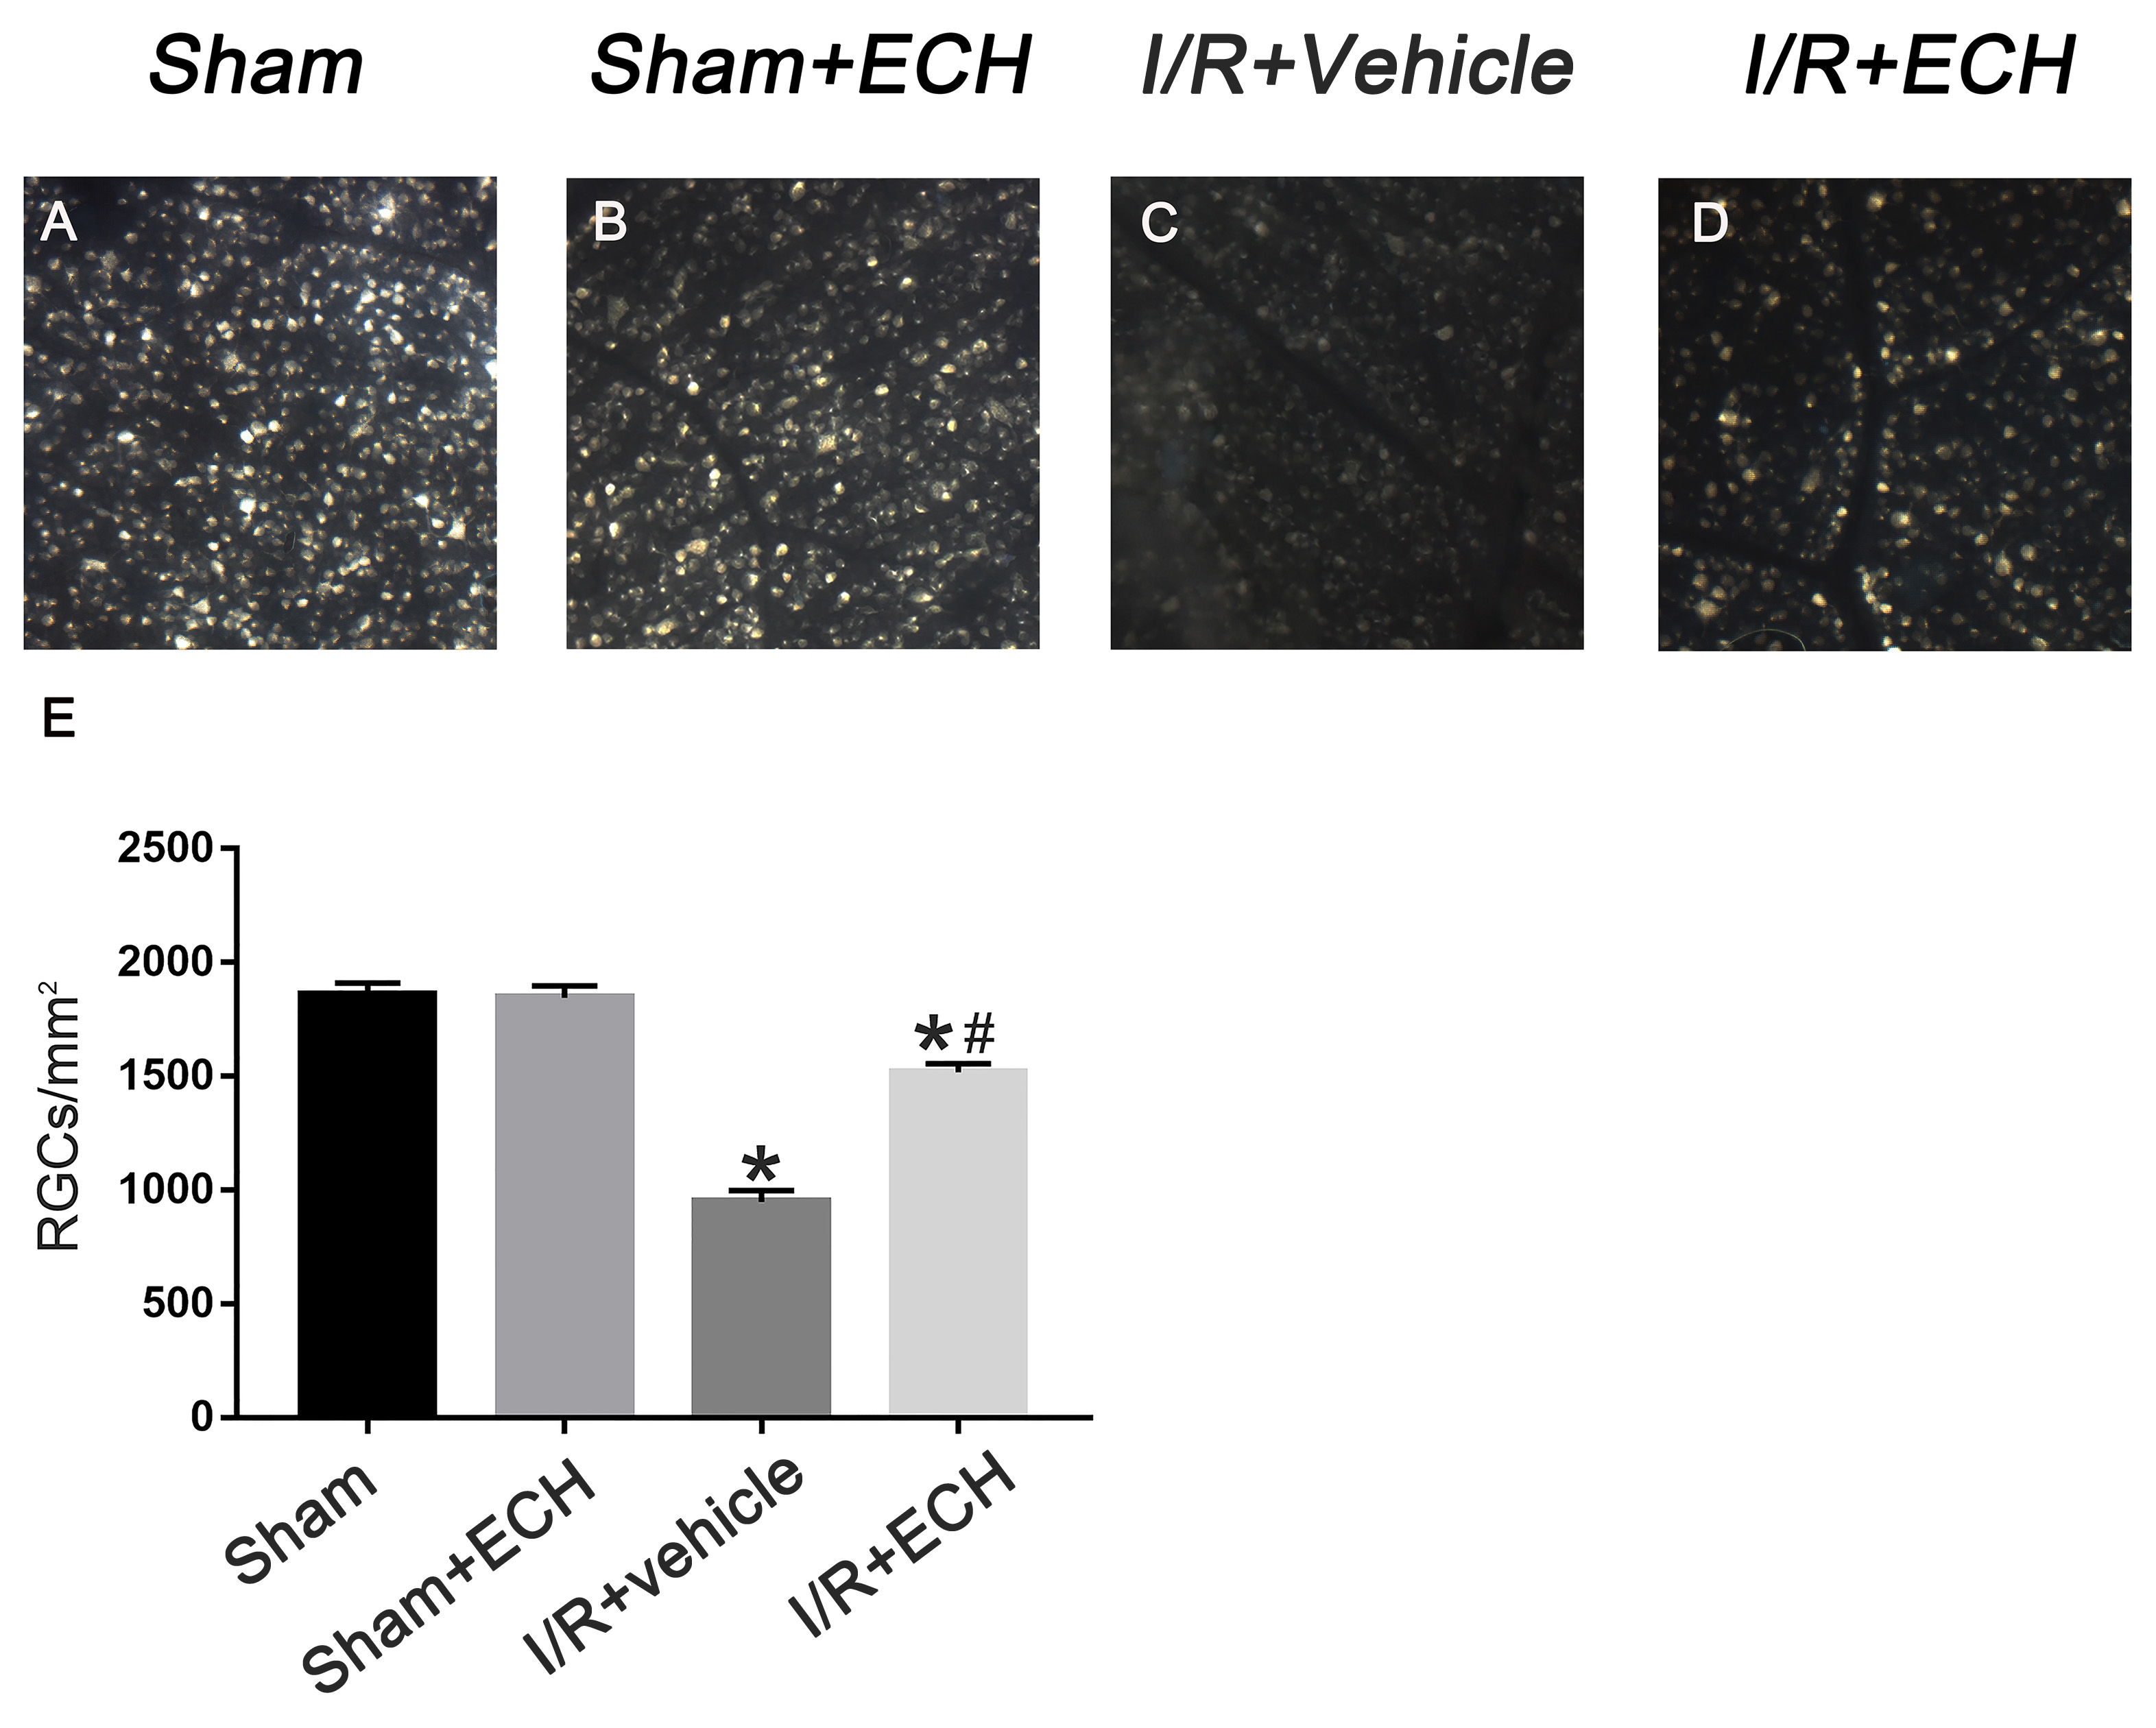
 Figure 2 of
Li, Mol Vis 2018; 24:746-758.
Figure 2 of
Li, Mol Vis 2018; 24:746-758.