Figure 1 of
García-Caballero, Mol Vis 2018; 24:733-745.
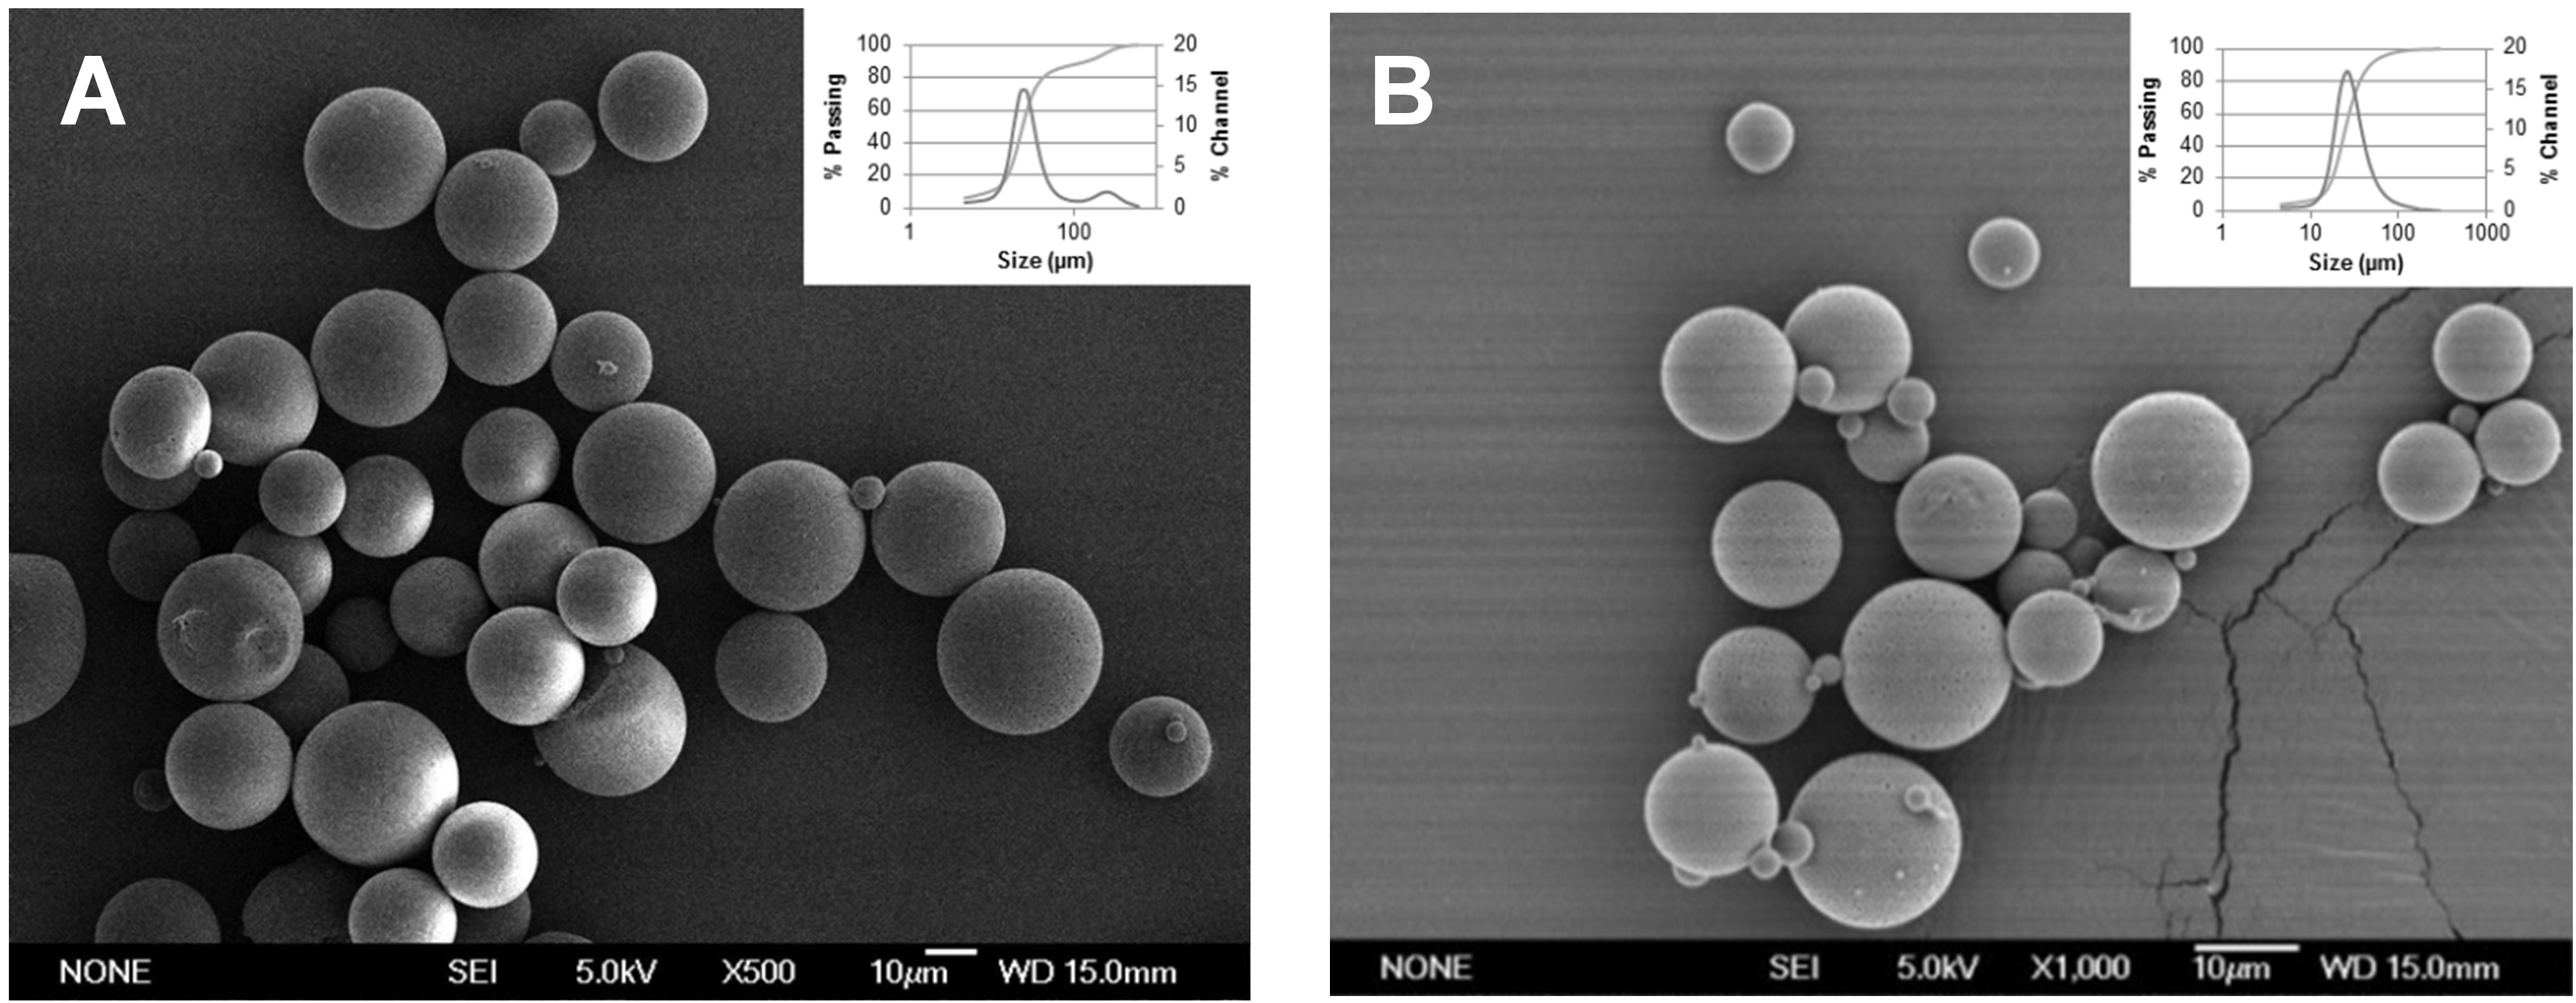
Figure 1.
Morphological and size analysis. Scanning electron microscopy images of (
A
) glial cell line–derived neurotrophic factor/vitamin E (GDNF/VitE)-loaded microspheres and (
B
) GDNF/VitE/melatonin-loaded microspheres. Inset: Particle size distribution.
 Figure 1 of
García-Caballero, Mol Vis 2018; 24:733-745. Figure 1 of
García-Caballero, Mol Vis 2018; 24:733-745.
Figure 1 of
García-Caballero, Mol Vis 2018; 24:733-745. Figure 1 of
García-Caballero, Mol Vis 2018; 24:733-745.