Figure 2. Retinal endothelial cells grown in NG, HG, or normal glucose plus mannitol. Cells in normal glucose (NG) and high glucose
(HG) were treated with an Epac1 agonist. A: Enzyme-linked immunosorbent assay (ELISA) results for SIRT1. B: HMGB1 levels. *p<0.05 versus NG, #p<0.05 versus HG, n=4 for all groups. Data are mean ± standard error of the mean (SEM).
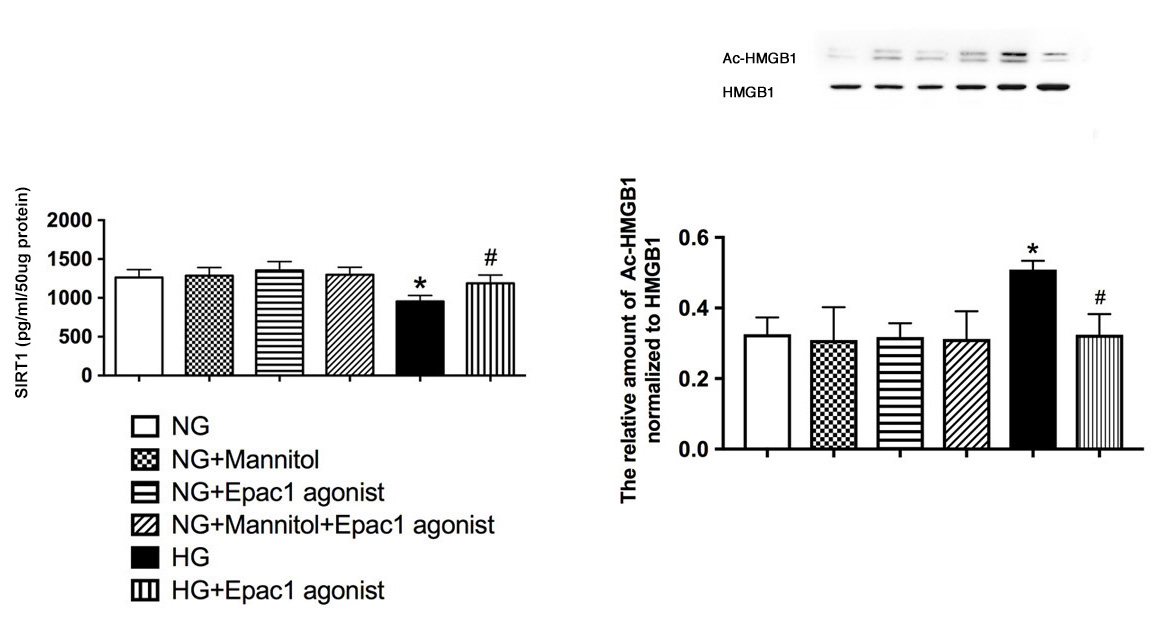
 Figure 2 of
Jiang, Mol Vis 2018; 24:727-732.
Figure 2 of
Jiang, Mol Vis 2018; 24:727-732.