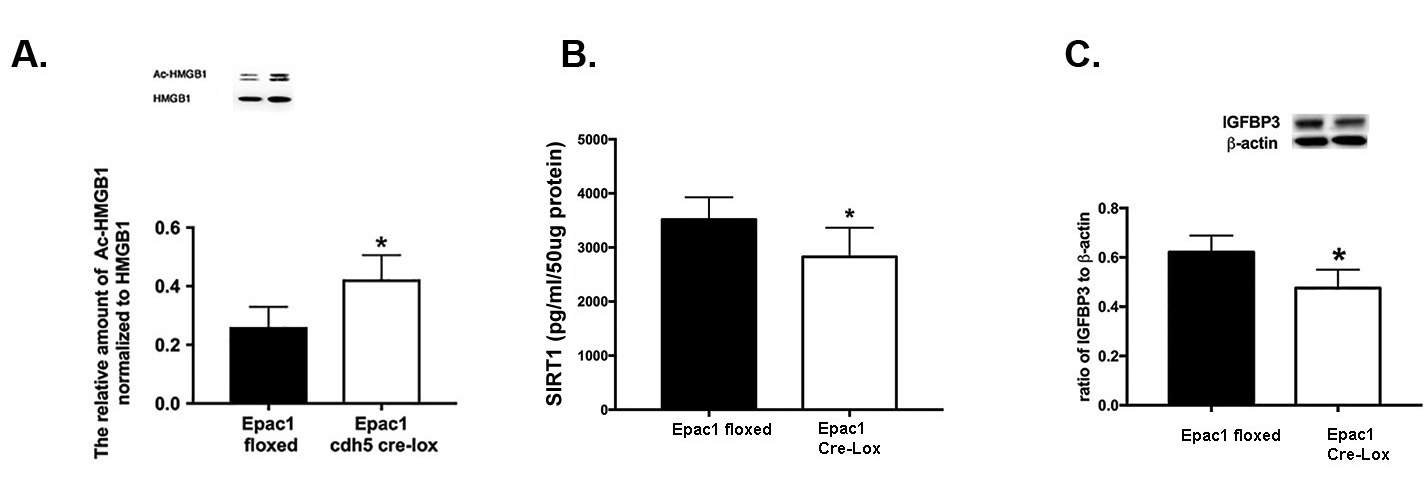
Figure 1. Protein data from Epac1 floxed and endothelial cell–specific Epac1 knockout mice. A: Acetylation of HMGB1. B: SIRT1 enzyme-linked immunosorbent assay (ELISA). C: IGFBP-3 levels. *p<0.05 versus floxed mice. n=5 mice (two eyes per mouse pooled). Panels A and C show representative blots from the mice. Data are mean ± standard error of the mean (SEM).

 Figure 1 of
Jiang, Mol Vis 2018; 24:727-732.
  Figure 1 of
Jiang, Mol Vis 2018; 24:727-732.