Figure 1. Fundus appearance of patients with BCD in stages 1. Stage 1-A–C; patient 028094), Stage 2-D–F; patient 028130), and Stage 3-G–I; patient 028092). A: Crystalline deposits in the posterior pole are shown in the color image. B: Autofluorescence (AF) was normal in the posterior pole as shown in the fundus autofluorescence (FAF) image. C: The RPE layer and the inner retina are normal on spectral domain optical coherence tomography (SD-OCT). D: Discoloration and crystalline deposits in the color image extend beyond the posterior pole. E: Areas of hypofluorescence and hyperfluorescence are seen beyond the posterior. F: Drusen-like deposits and extensive loss of the outer retina are noted. Outer retinal tubulation (the red triangle) is present.
G: Diffuse atrophy of the RPE and choroidal sclerosis are obvious. The number of crystalline deposits is fewer than in stage
2. Pigment deposits are seen. H: The AF in the posterior pole is almost absent. I: Diffuse loss of the ellipsoid zone, the interdigitation zone, and the RPE is shown in both eyes of the patient.
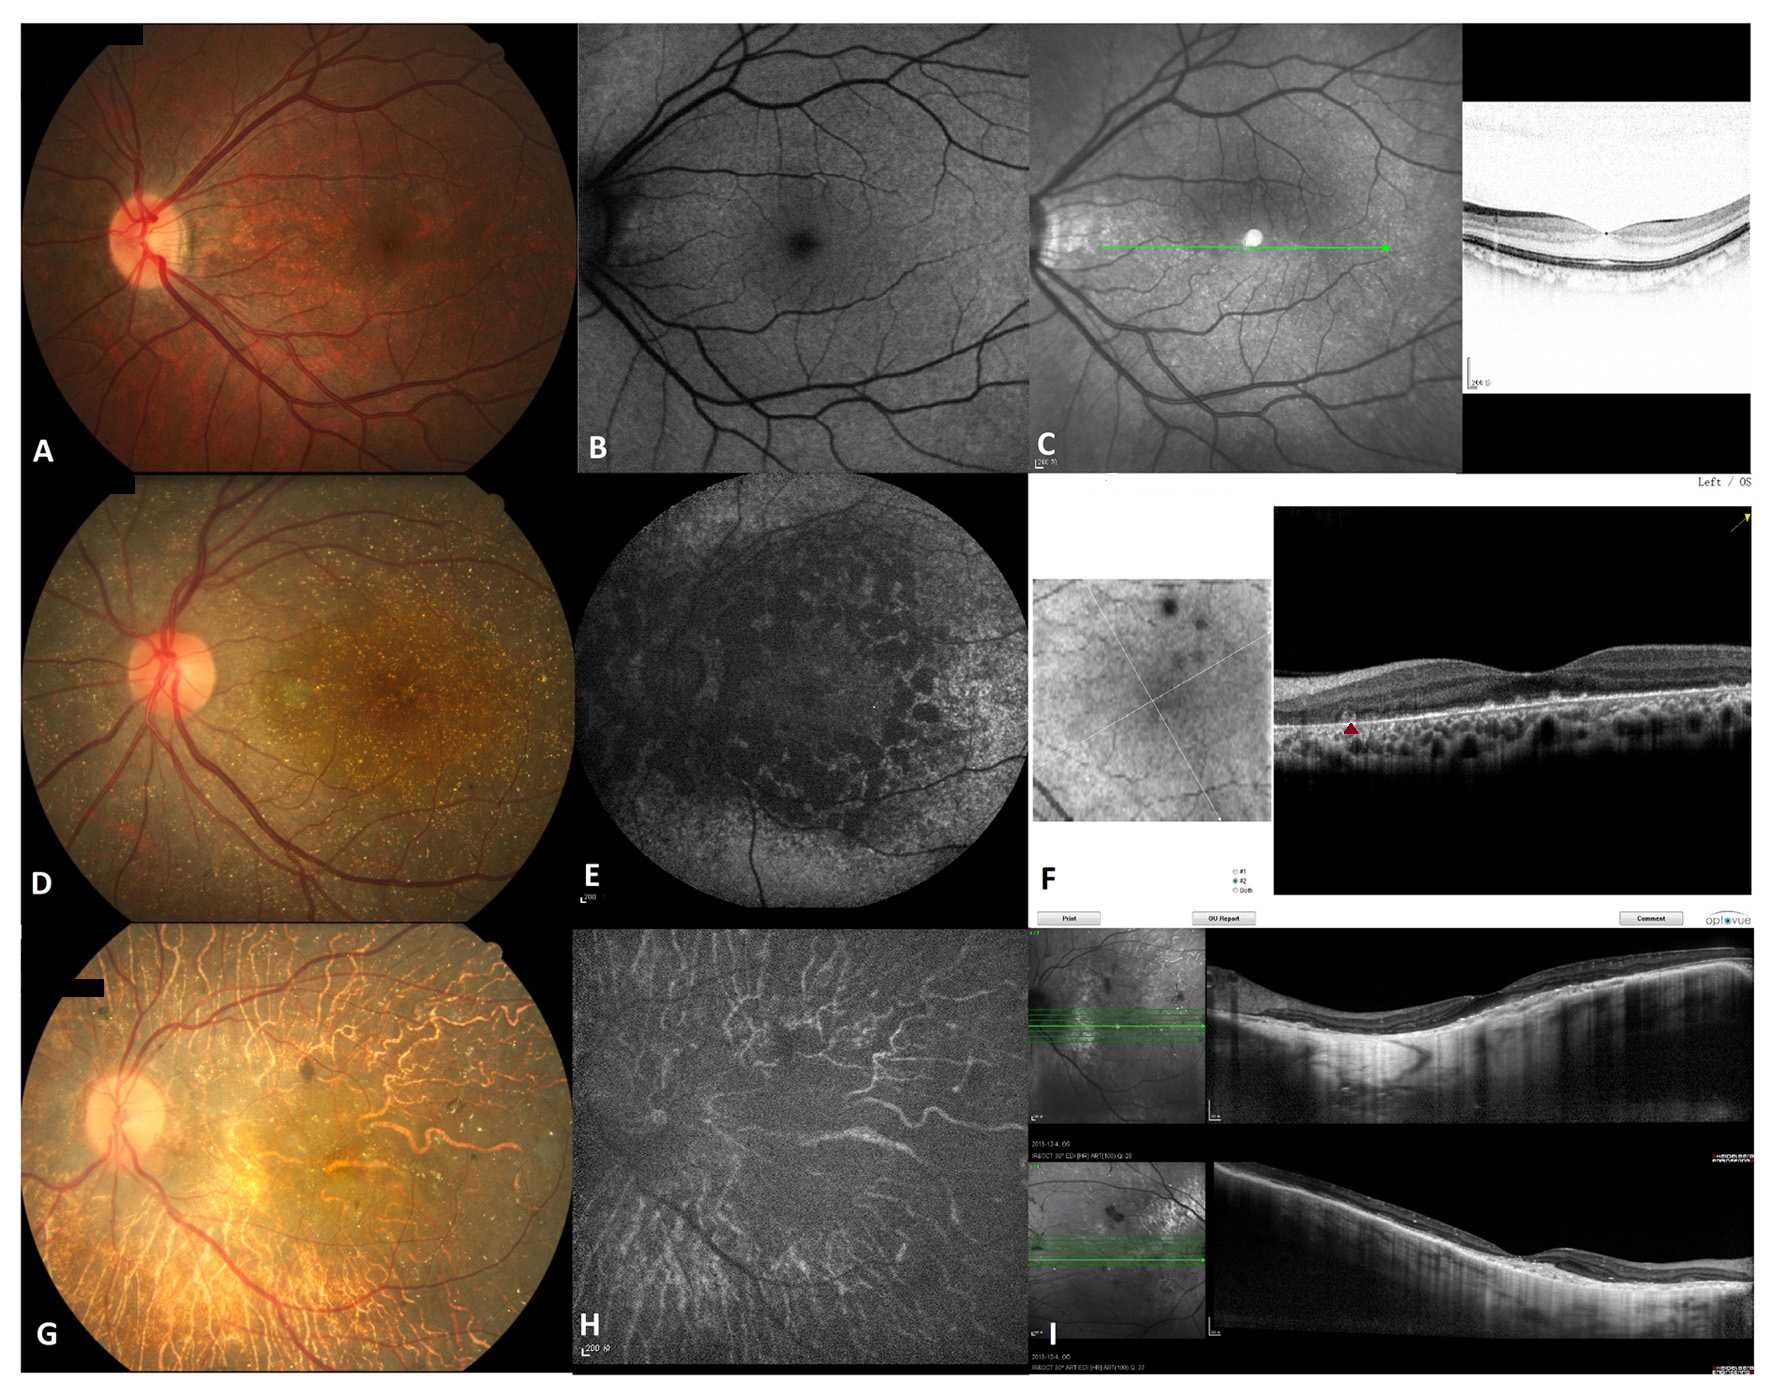
 Figure 1 of
Zhang, Mol Vis 2018; 24:700-711.
Figure 1 of
Zhang, Mol Vis 2018; 24:700-711.