Figure 3 of
Ravesh, Mol Vis 2018; 24:679-689.
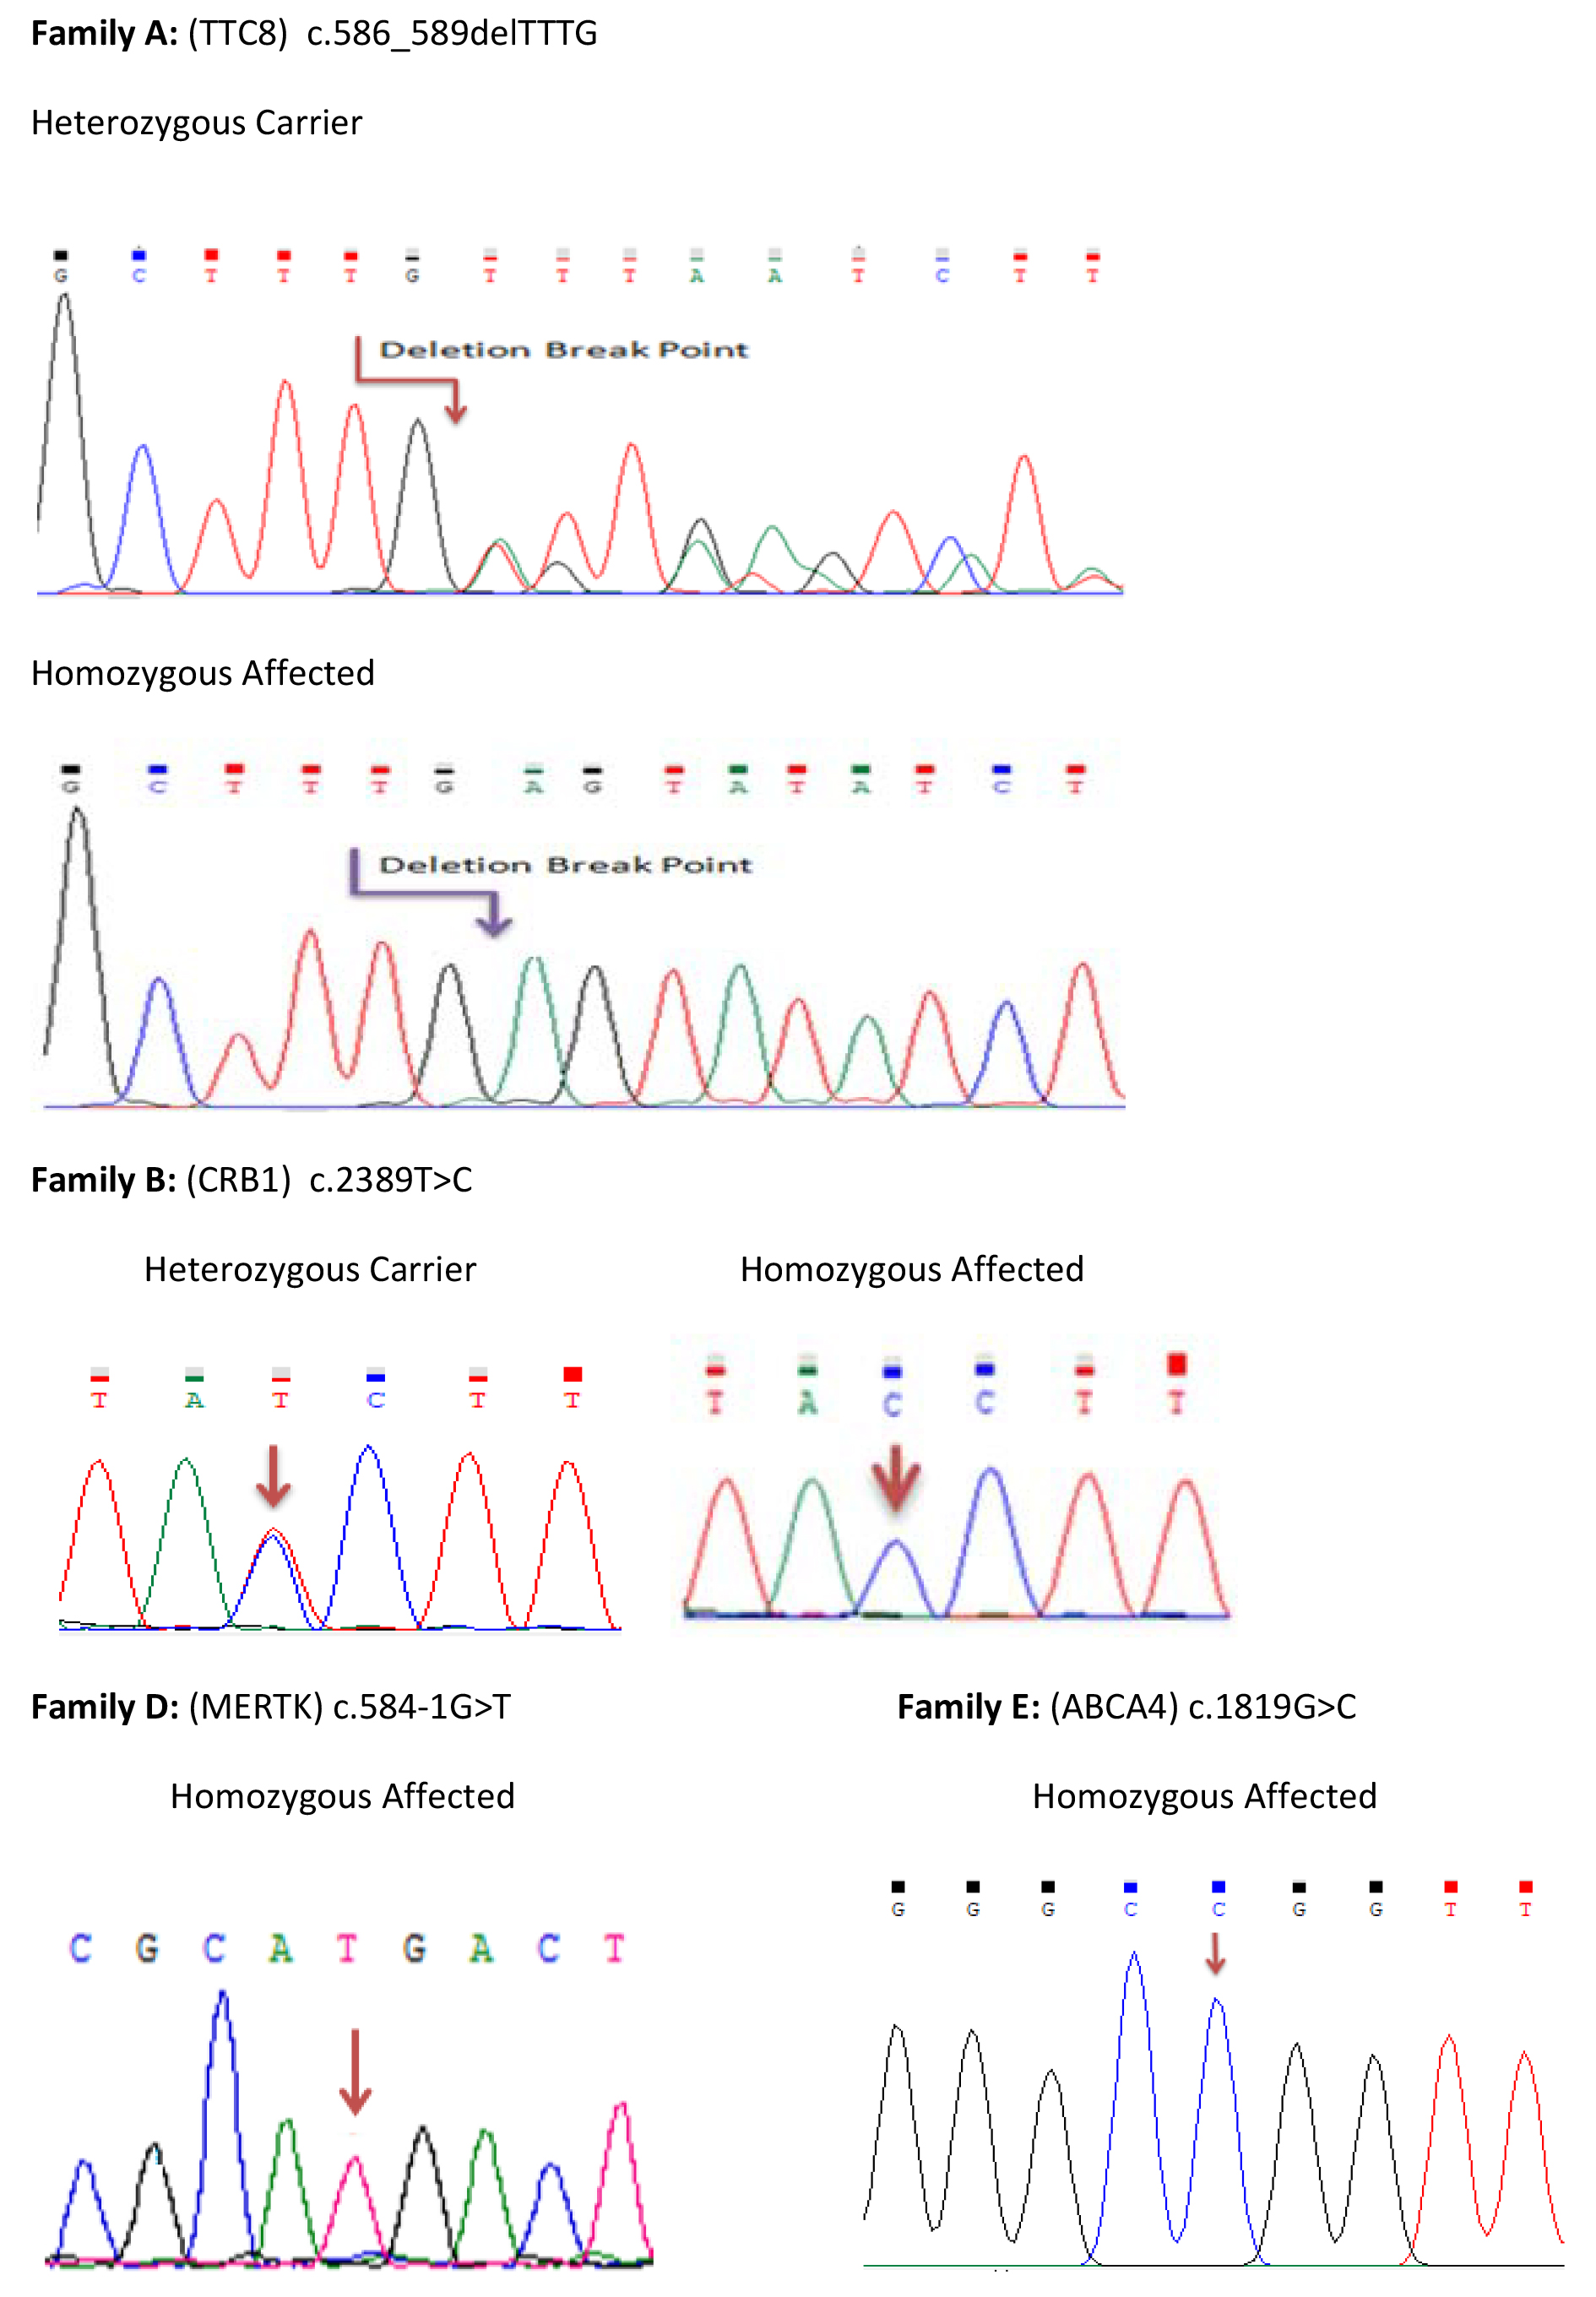
Figure 3.
Chromatogram of families A, B, D, and E presenting homozygous affected and cosegregation analysis in the kindred. Arrow indicates the location of the nucleotide variation.
 Figure 3 of
Ravesh, Mol Vis 2018; 24:679-689.
Figure 3 of
Ravesh, Mol Vis 2018; 24:679-689.