Figure 2. High NaCl-induced gene expression of various members of the Jun, Fos, ATF, JDP, and CREB protein families. A: Presence of gene transcripts in RPE cells. To confirm the correct lengths of the PCR products, agarose gel electrophoresis
was performed using products obtained from two RPE cell lines (1, 2) derived from different post-mortem donors. Negative controls
(0) were performed by adding double-distilled water instead of cDNA as template. The β-actin (ACTB) mRNA level was used to normalize the c-Fos and c-Jun mRNA levels. B: Gene expression levels after the cells were stimulated for 2, 6, and 24 h (as indicated by the panels of the bars) with
high (+ 100 mM) NaCl. mRNA levels were determined with real-time reverse transcription (RT)–PCR and are expressed as folds
of the unstimulated control. Each bar represents data obtained in four independent experiments using cell lines from different
donors. Significant difference versus unstimulated control: * p<0.05.
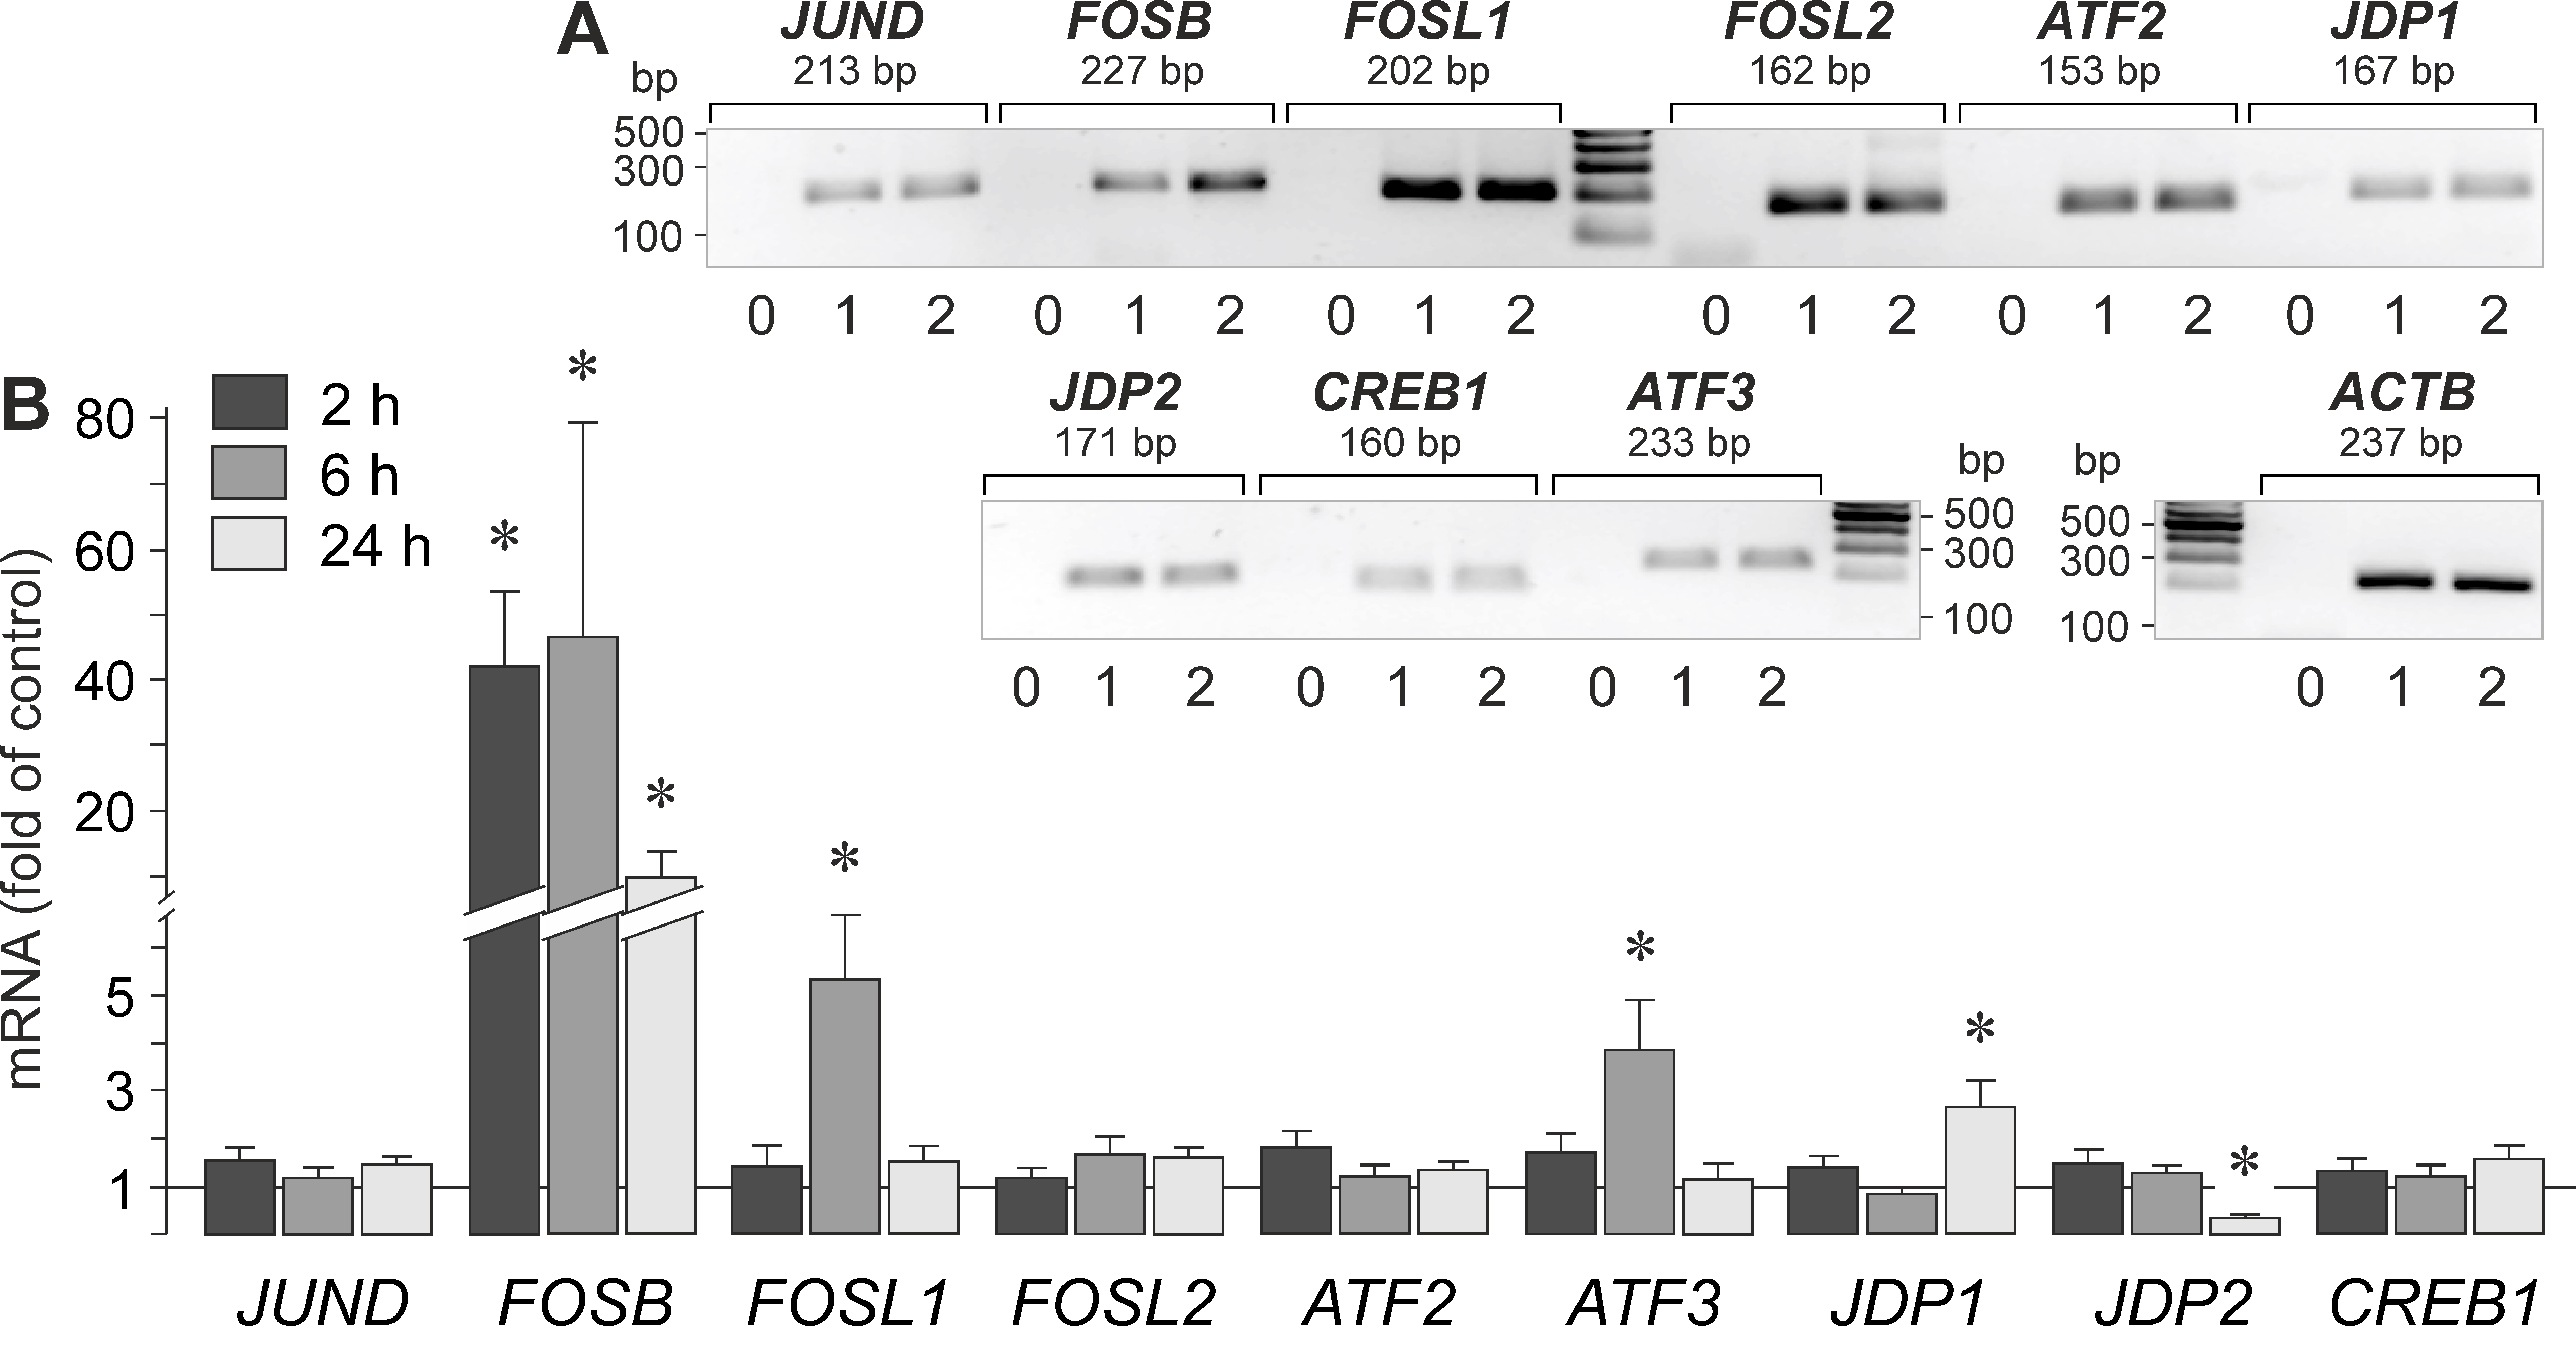
 Figure 2 of
Kleiner, Mol Vis 2018; 24:647-666.
Figure 2 of
Kleiner, Mol Vis 2018; 24:647-666.