Figure 4. Differential expression of circulatory microRNAs in old compared to young Rhesus macaques. Data are presented as fold change
(FC) values (−1.5 ≥ FC ≥ 1.5; p<0.05) of the old animals compared to young animals in the plasma (young: n=4, old: n=4; A), vitreous (young: n=4, old: n=3; B), and aqueous (young: n=4, old: n=4; C). Error bars represent the standard deviation (SD) between the replicate samples.
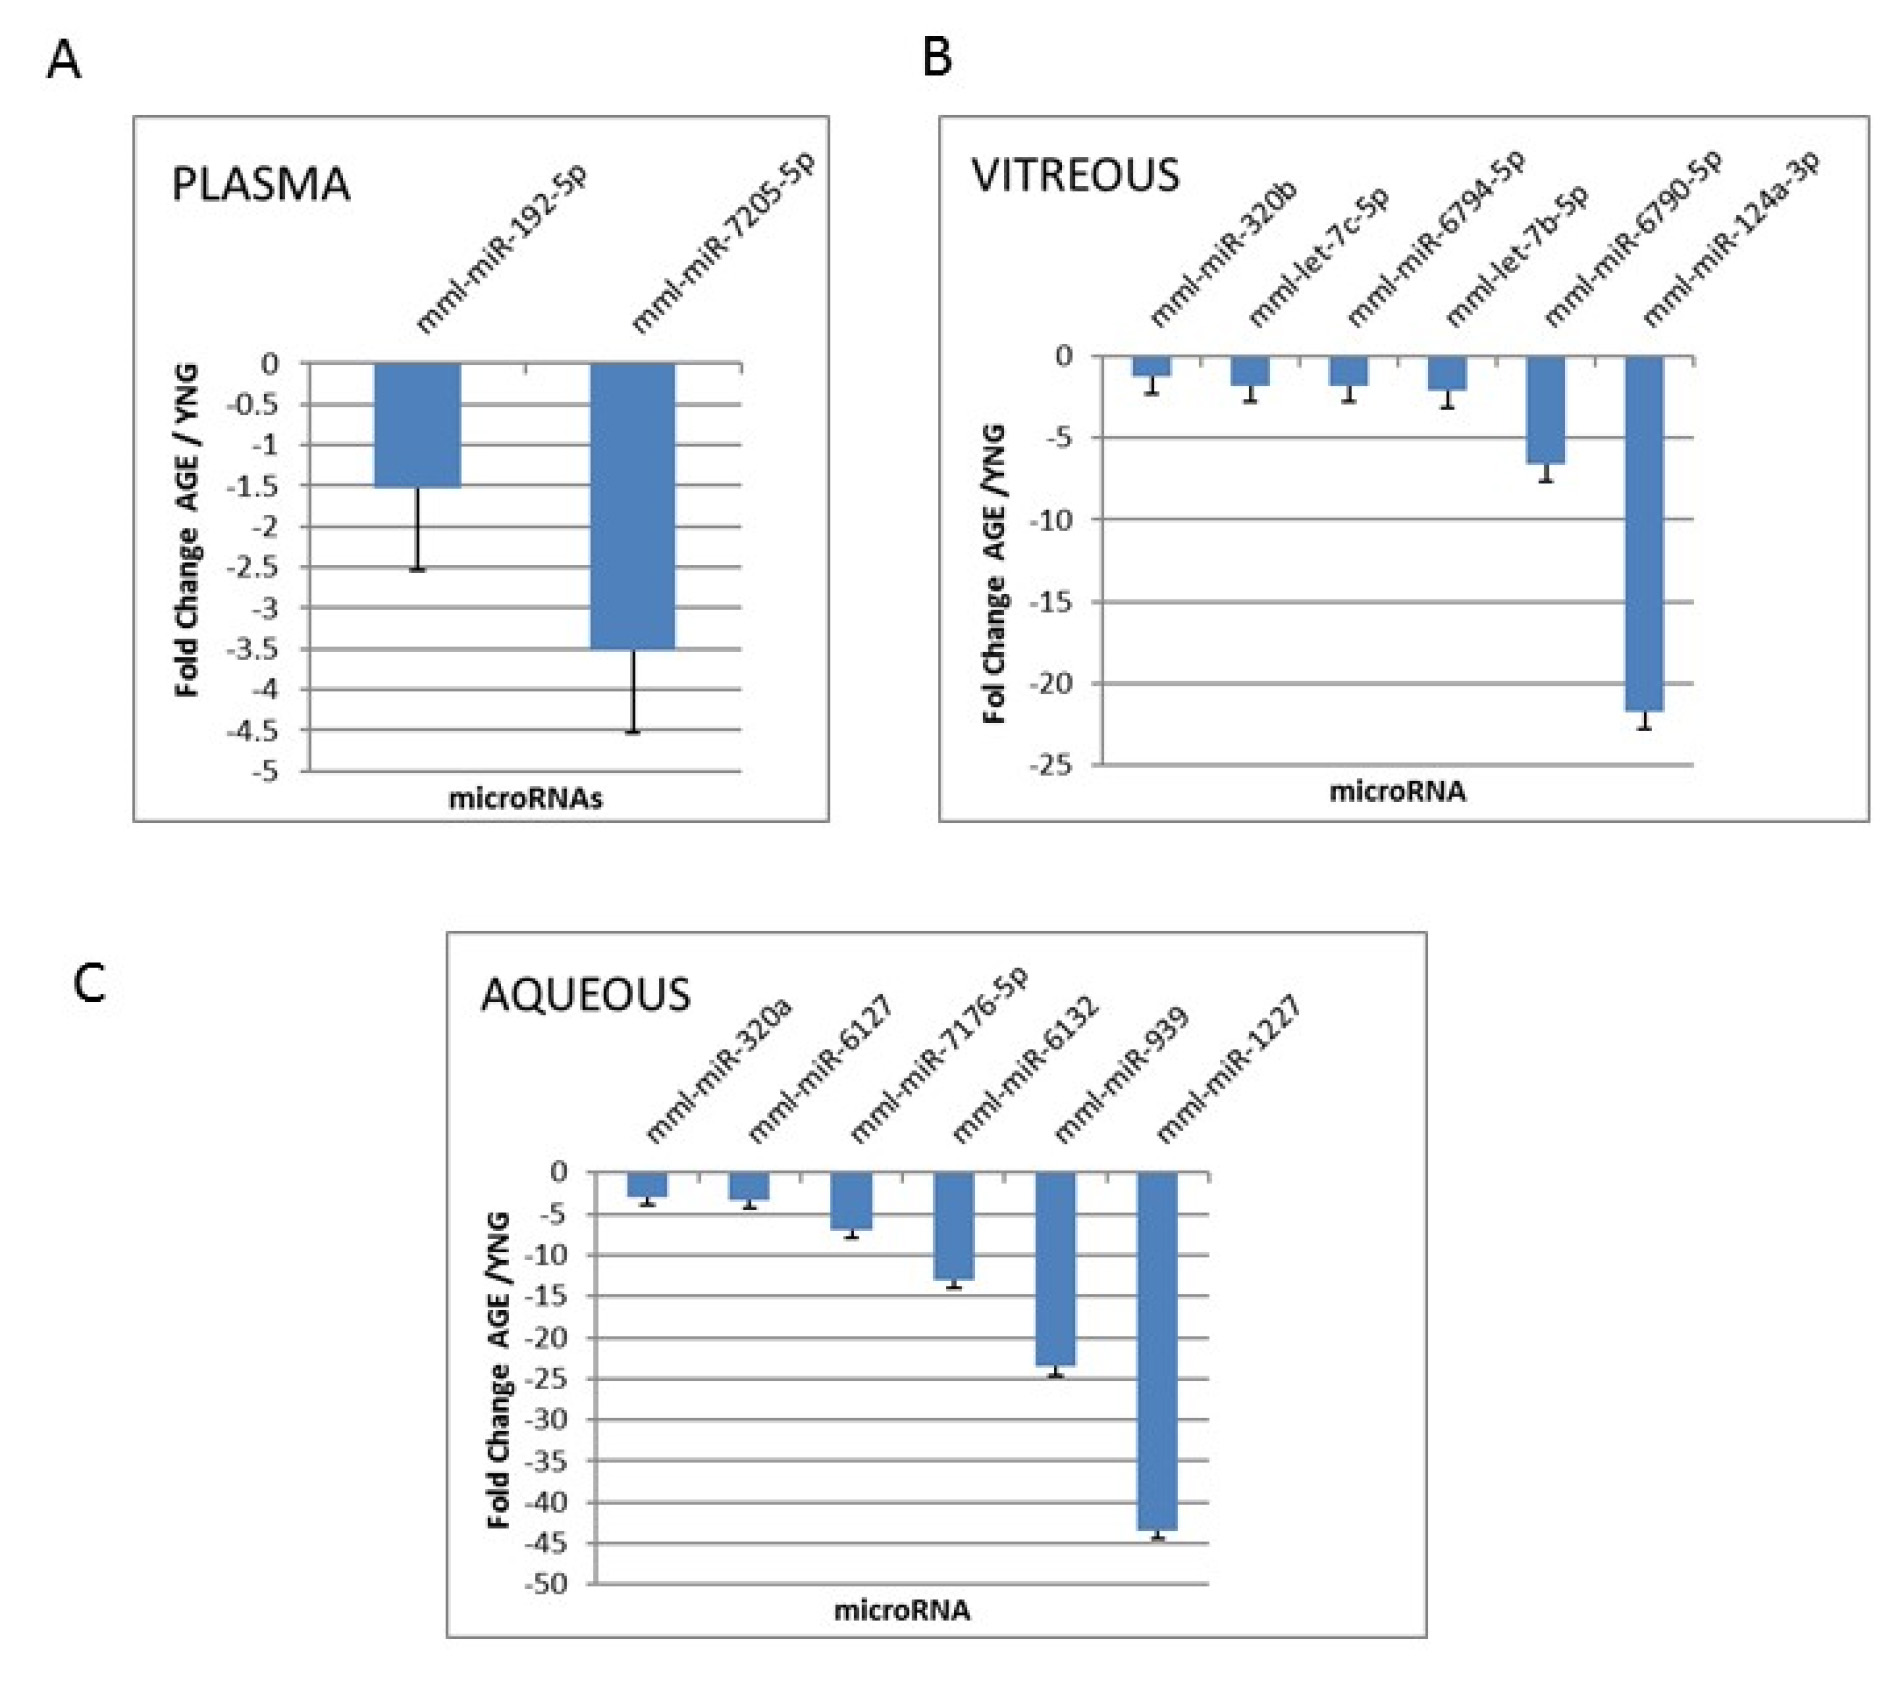
 Figure 4 of
Smit-McBride, Mol Vis 2018; 24:633-646.
Figure 4 of
Smit-McBride, Mol Vis 2018; 24:633-646.