Figure 1. Effect of bilberry extract, and its constituent anthocyanins, or Dp3G, Cy3G, and Mv3G individually, on the aggregation of
S-opsin induced by exposure to blue LED light. Representative immunostained images of S-opsin after exposure to blue light-emitting
diode (LED) light for 6 h and quantitative data after (A) bilberry extract, (B) delphinidin-3-glucoside (Dp3G), (C) cyanidin-3-glucoside (Cy3G), and (D) malvidin-3-glucoside (Mv3G). The quantitative analysis of the immunostained images is the ratio of the aggregated S-opsin
cells. Data are the mean ± standard error of the mean (SEM; n=3 or 4). ##p<0.01 versus control; **p<0.01, *p<0.05 versus the vehicle (Dunnett’s multiple comparison tests or Student t tests). The scale bar represents 50 µm. Arrowheads indicate the aggregation of S-opsin.
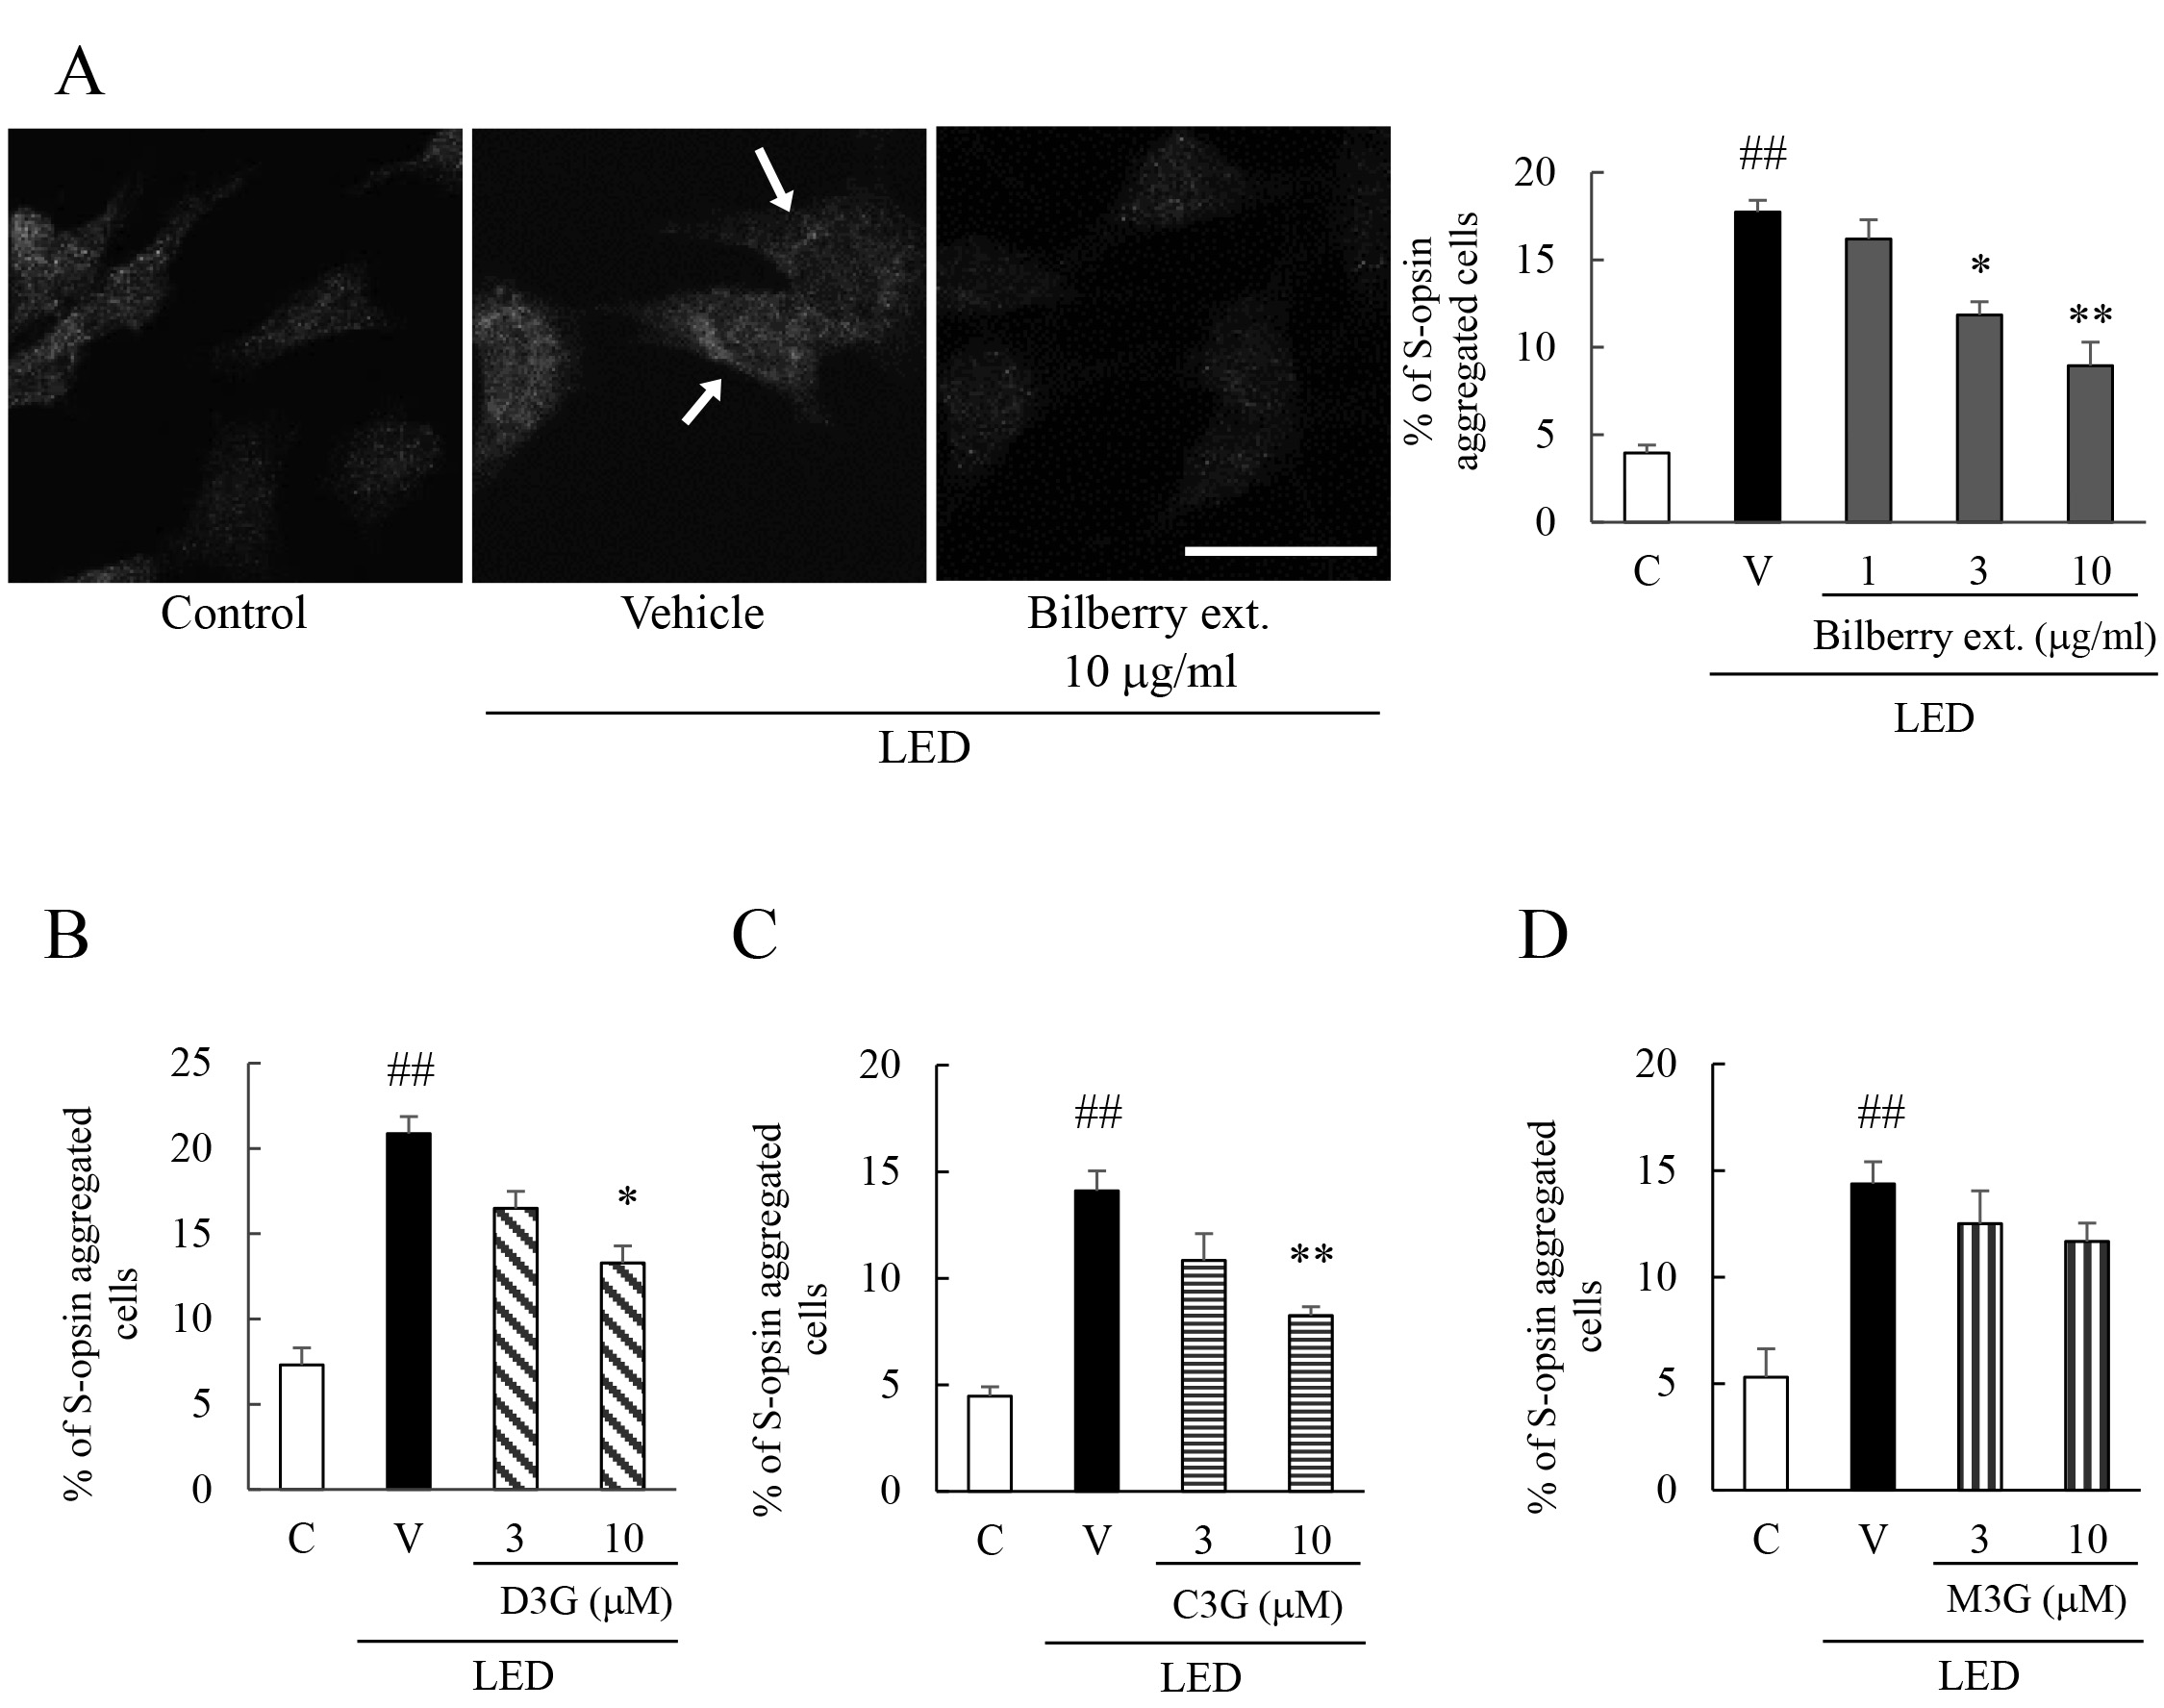
 Figure 1 of
Ooe, Mol Vis 2018; 24:621-632.
Figure 1 of
Ooe, Mol Vis 2018; 24:621-632.