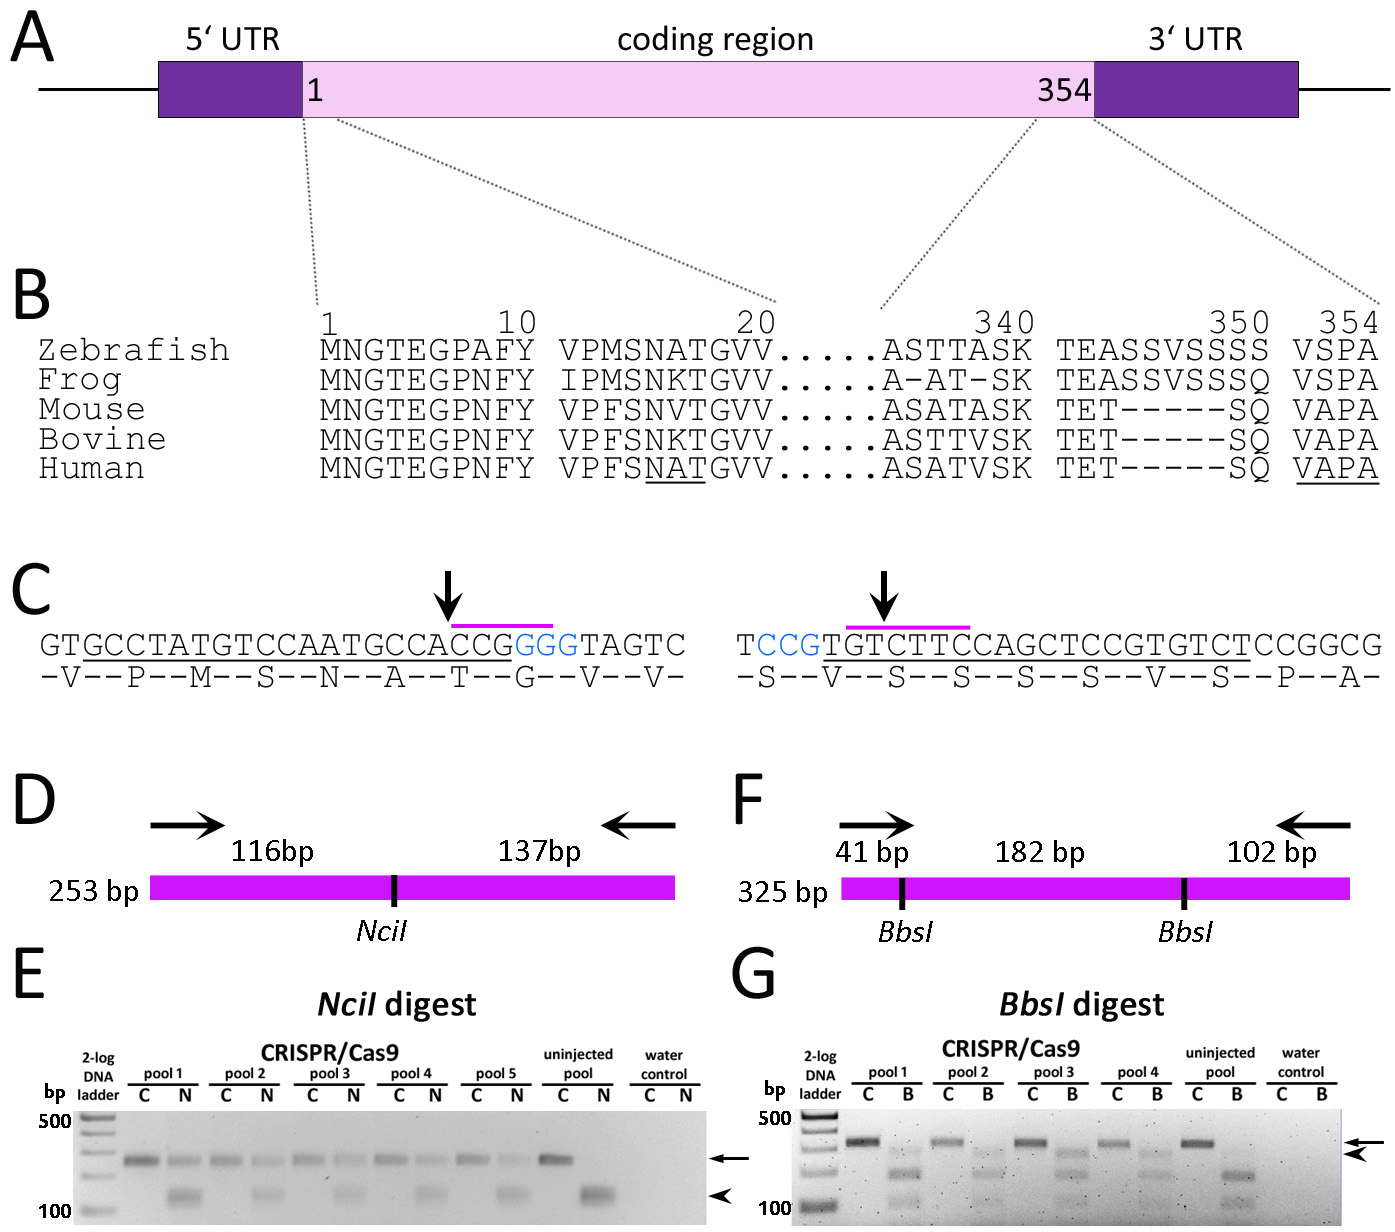
Figure 1. Gene targeting of zebrafish
rh1-1.
A: Schematic representation of the zebrafish
rh1-1 locus characterized by a single exon encoding 354 amino acid proteins and 5′ and 3′ UTRs.
B: Alignment of Rho N- and C-terminal amino acid sequences across species. Numbering is based on the predicted zebrafish
rh1–1. The conserved N-linked glycosylation sequence and VXPX targeting sequence are underlined.
C: DNA sequence and amino acid overlay of zebrafish
rh1–1 5′- (left) and 3′- (right) coding sequences. Blue text represents the CRISPR PAM sequence. Underlined DNA represents the
target for guide RNA hybridization. The purple overscore represent restriction sites for
NciI or
BbsI. Arrows indicate predicted Cas9 cleavage sites.
D: Diagrammatic representation of the 253-bp 5′-
rh1–1 gene amplicon and the predicted products following digestion with
NciI.
E: RFLP analysis of a 253-bp PCR product spanning the 5′
rh1–1 gene (C, undigested control) and digested with
NciI (N) shows retention of the original amplicon (arrow) from pooled DNA from injected embryos versus complete digestion of
the PCR product of uninjected control DNA (arrowhead).
F: Diagrammatic representation of the 325-bp 3′-amplicon and the predicted products following digestion with
BbsI.
G: RFLP analysis of a 325-bp PCR product (C, undigested control) spanning the 3′
rh1–1 sequence digested with
BbsI (B). The PCR product (arrow) from uninjected-controls was digested to near completion, yielding two visible bands of 102
and 182 bp. The 284-bp band (arrowhead) following loss of the 5′-
BbsI site is clearly visible in the injected embryos relative to the controls. The following sequences were used for the RHO
alignment:
Danio rerio (
NP571159.1),
X. laevis (
NP001080517.1),
Mus musculus (
NP663358.1),
Bos taurus (
NP001014890.1), and
Homo sapiens (
NP000530.1).
 Figure 1 of
Zelinka, Mol Vis 2018; 24:587-602.
Figure 1 of
Zelinka, Mol Vis 2018; 24:587-602.