Figure 3. The expression of GABA receptors in the ARC in the chronic high IOP rat model. A: Immunohistochemical (IHC) staining of GABA-A receptors and GABA-B receptors in brain sections at the location of the arcuate
nucleus (ARC). B and C: Counting of positive cells in IHC-stained sections with Image J (ctl versus 2 weeks, **p<0.01; ctl versus 4 weeks, **p<0.01).
D: Immunofluorescence (IF) staining of GABA-A receptors and GABA-B receptors in brain sections at the location of the ARC.
E and F: Counting of positive cells in IF-stained sections with Image J (ctl versus 2 weeks, **p<0.01; ctl versus 4 weeks, **p<0.01).
The data are expressed as mean ± standard error of the mean (SEM), n=6 per group. Bar=50 μm. ctl: normal untreated rat, 2w:
chronic high IOP rat group euthanized 2 weeks after the surgery, 4w: chronic high IOP rats group euthanized 4 weeks after
the surgery.
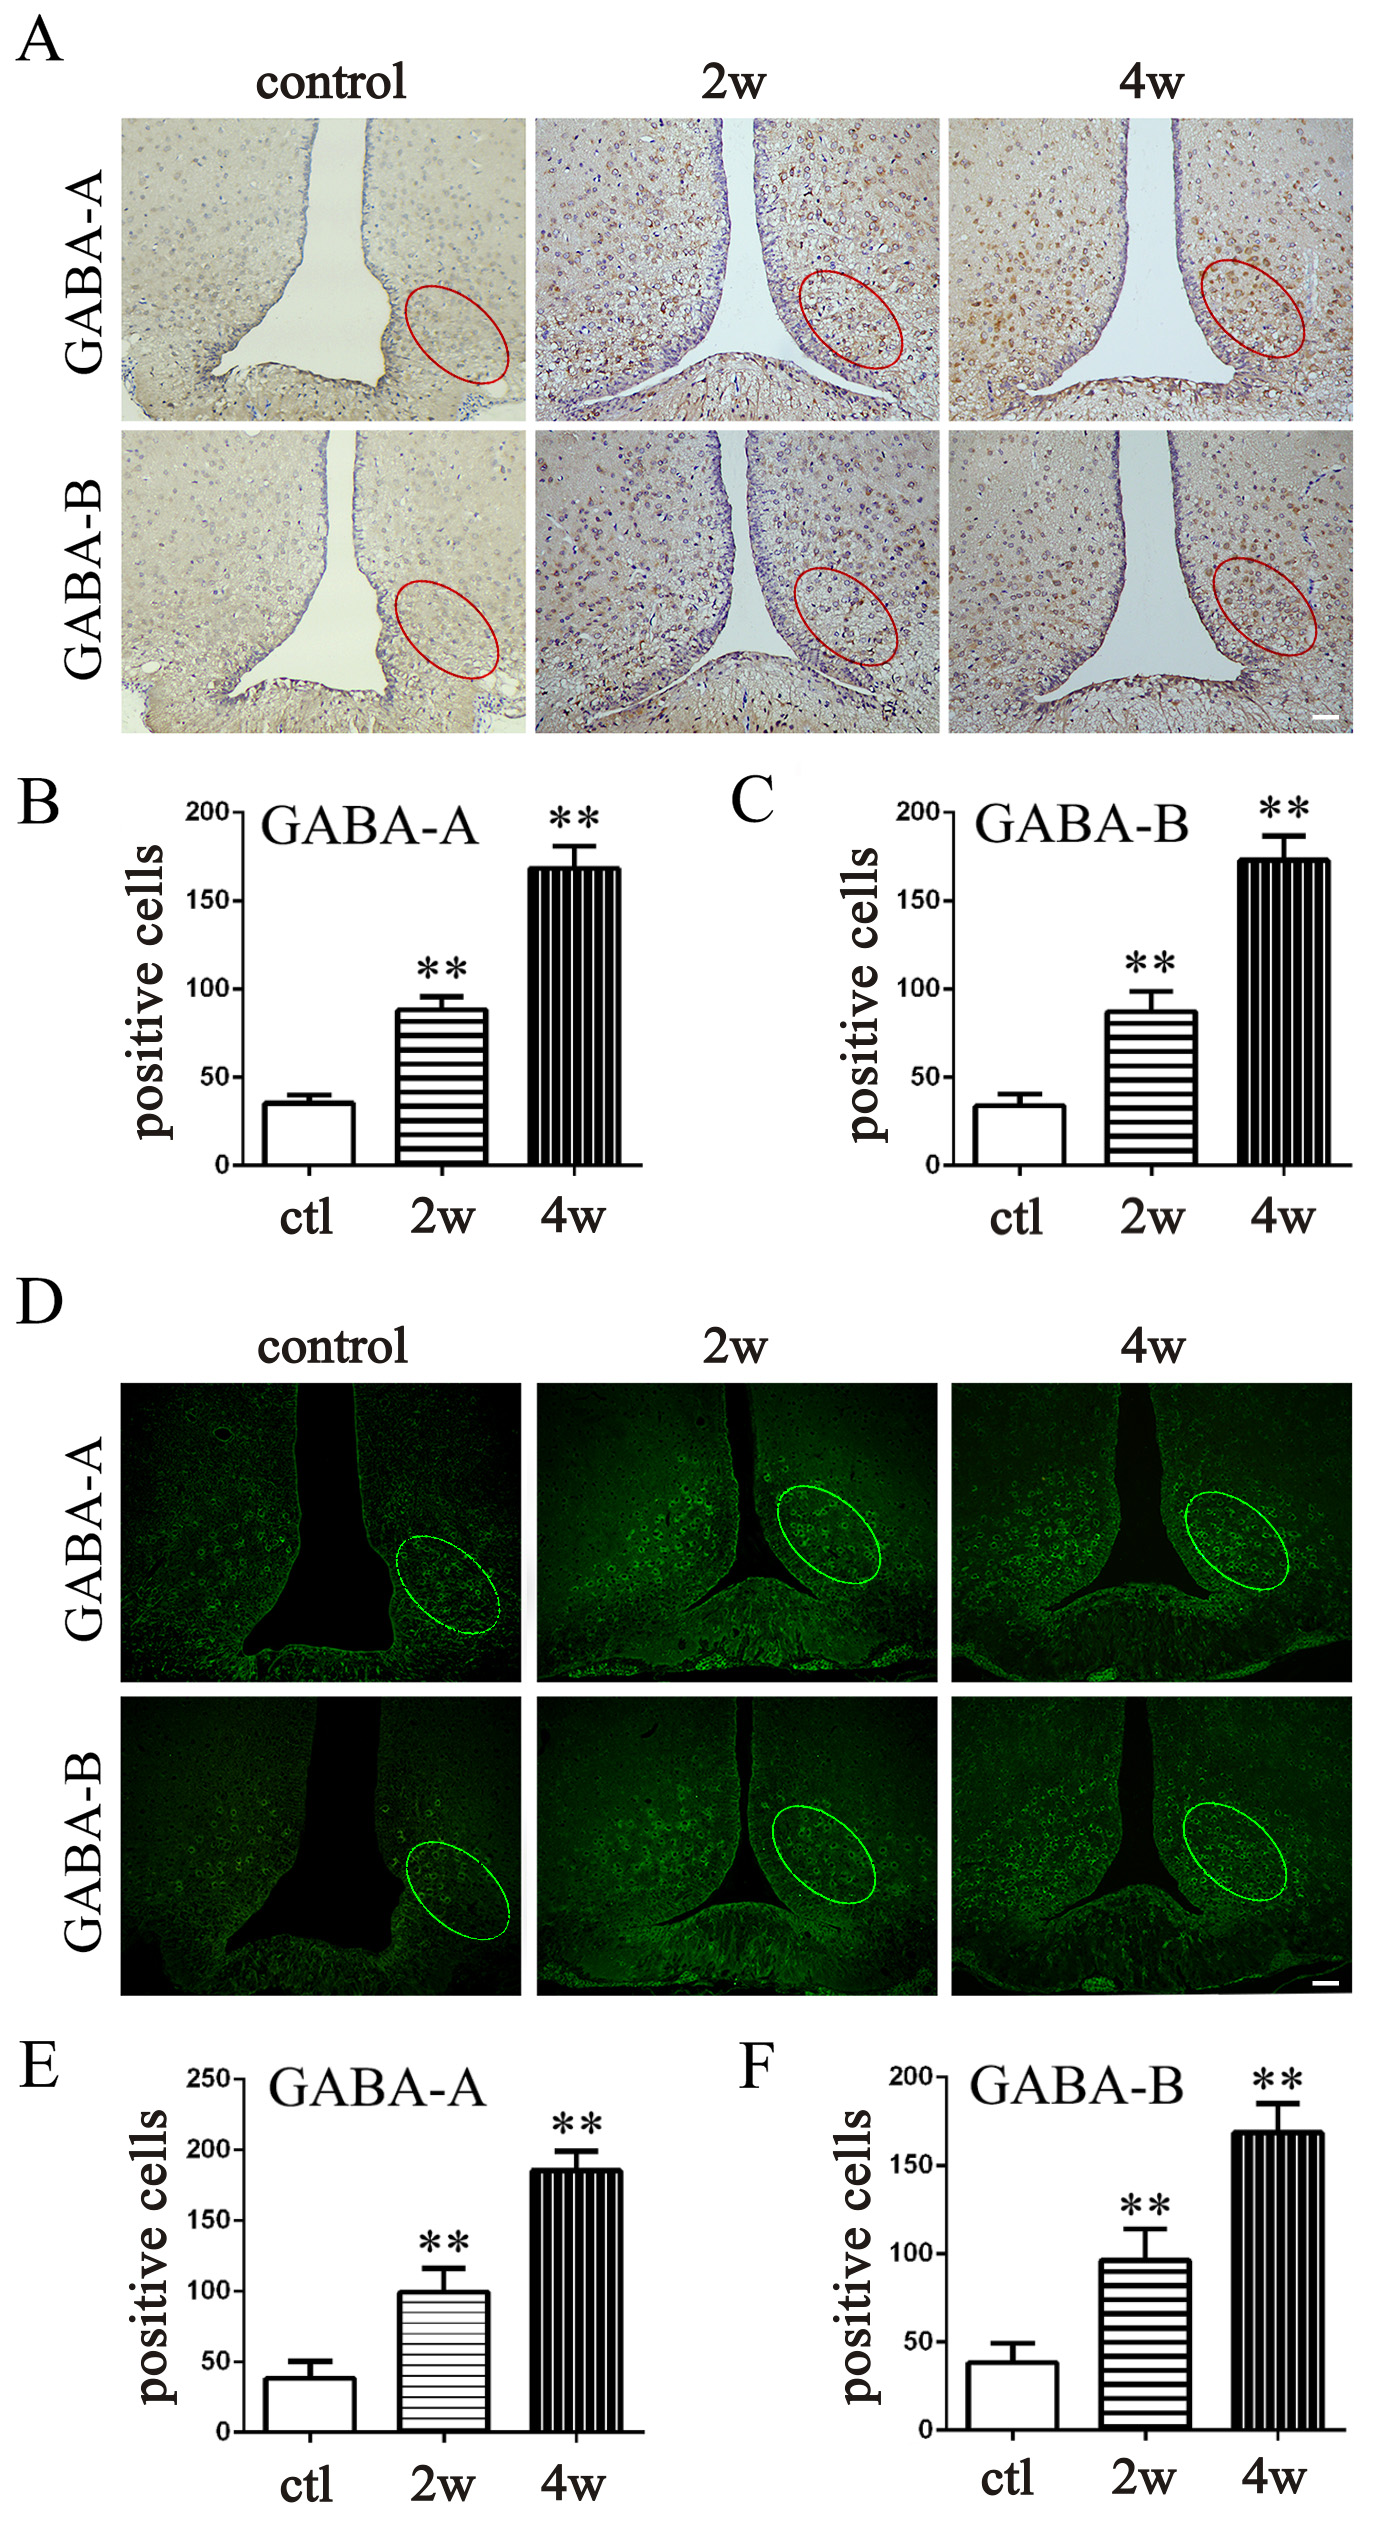
 Figure 3 of
Gong, Mol Vis 2018; 24:574-586.
Figure 3 of
Gong, Mol Vis 2018; 24:574-586.