Figure 2. Effect of IBO injection into the ARC on IOP in chronic high IOP rat model. The intraocular pressure (IOP) of the ipsilateral
eye in the ibotenic acid (IBO)-treated group and the control group at the 0, 1, 2, 3, and 4 week time points (chronic model
group + PBS versus chronic model + IBO group, **p<0.01). The red line: chronic model + IBO group; the black line: chronic
model group; the blue line: chronic model group + PBS group. The data are expressed as mean ± standard error of the mean (SEM),
n=6 per group.
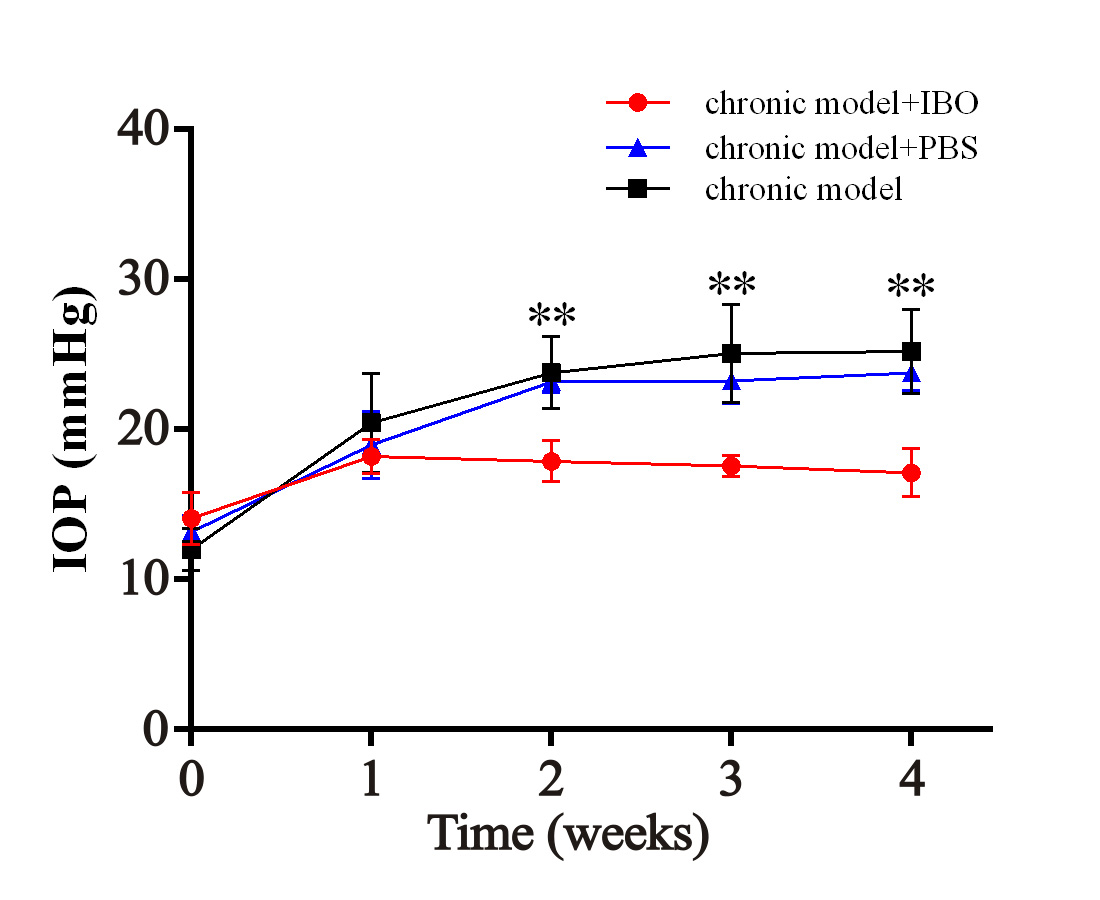
 Figure 2 of
Gong, Mol Vis 2018; 24:574-586.
Figure 2 of
Gong, Mol Vis 2018; 24:574-586.