Figure 1. Effect of elevated IOP on retinal ganglion cells in the chronic high IOP rat model. A: The bar graph illustrates the intraocular pressure (IOP) of two chronic high IOP rat groups and the control group (ctl versus
2 weeks, *p=0.037; ctl versus 4 weeks, **p=0.004). B and C: The retinal cross sections were stained with BRN3A or terminal deoxynucleotidyl transferase dUTP nick-end labeling (TUNEL).
D and E: The bar graph presents the number of BRN3A- or TUNEL-positive cells in the ganglion cell layer (GCL; ctl versus 2 weeks,
*p<0.01; ctl versus 4 weeks, *p<0.01). The data are expressed as mean ± standard error of the mean (SEM), n=6 per group. ctl:
normal untreated group, 2w: chronic high IOP rats group euthanized 2 weeks after the surgery, 4w: chronic high IOP rat group
euthanized 4 weeks after the surgery.
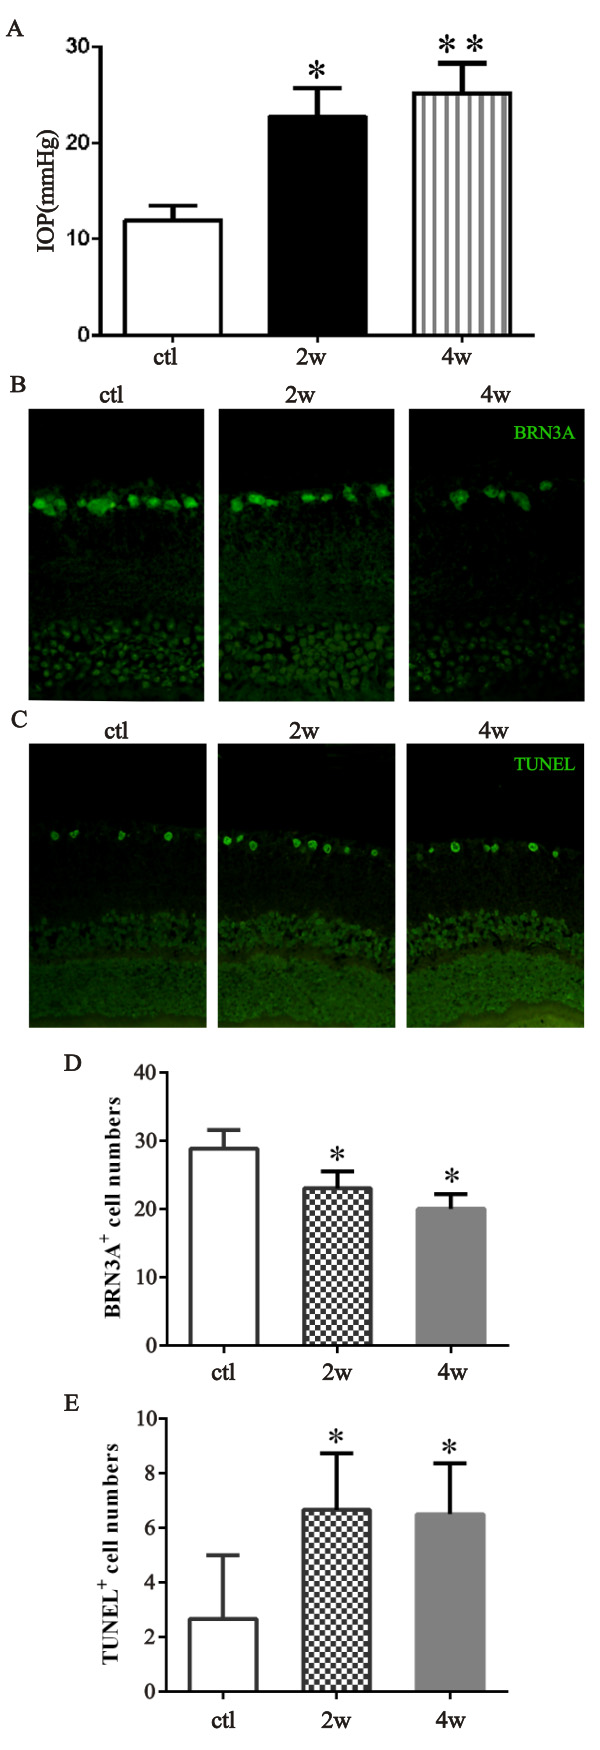
 Figure 1 of
Gong, Mol Vis 2018; 24:574-586.
Figure 1 of
Gong, Mol Vis 2018; 24:574-586.