Figure 4. Involvement of signal transduction pathways and transcription factors in the hyperosmotic and hypoxic expression of the C9
gene. A: The mRNA level was determined with real-time RT–PCR analysis in cells cultured for 2 h under isosmotic control conditions
(left) and hyperosmotic conditions (+ 100 mM NaCl; right). B: The mRNA level was determined in cells cultured for 24 h under control conditions (left) and in the presence of CoCl2 (150 µM; right). The following blocking compounds were tested: the inhibitor of p38 MAPK activation, SB203580 (10 µM); the inhibitor of
ERK1/2 activation, PD98059 (20 µM); the JNK inhibitor SP600125 (10 µM); the inhibitor of PI3K-related kinases, LY294002 (5
µM); an HIF-1 inhibitor (HIF-Inh; 5 µM); the NF-κB inhibitor caffeic acid phenethyl ester (CAPE; 1 µM); and the STAT3 inhibitor
Stattic (1 µM). Vehicle controls were made with DMSO (1:1000). The numbers of independent experiments using cell lines from
different donors are indicated in the bars. Significant difference versus unstimulated control: *p<0.05. Significant difference
versus NaCl and CoCl2 control: ●p<0.05.
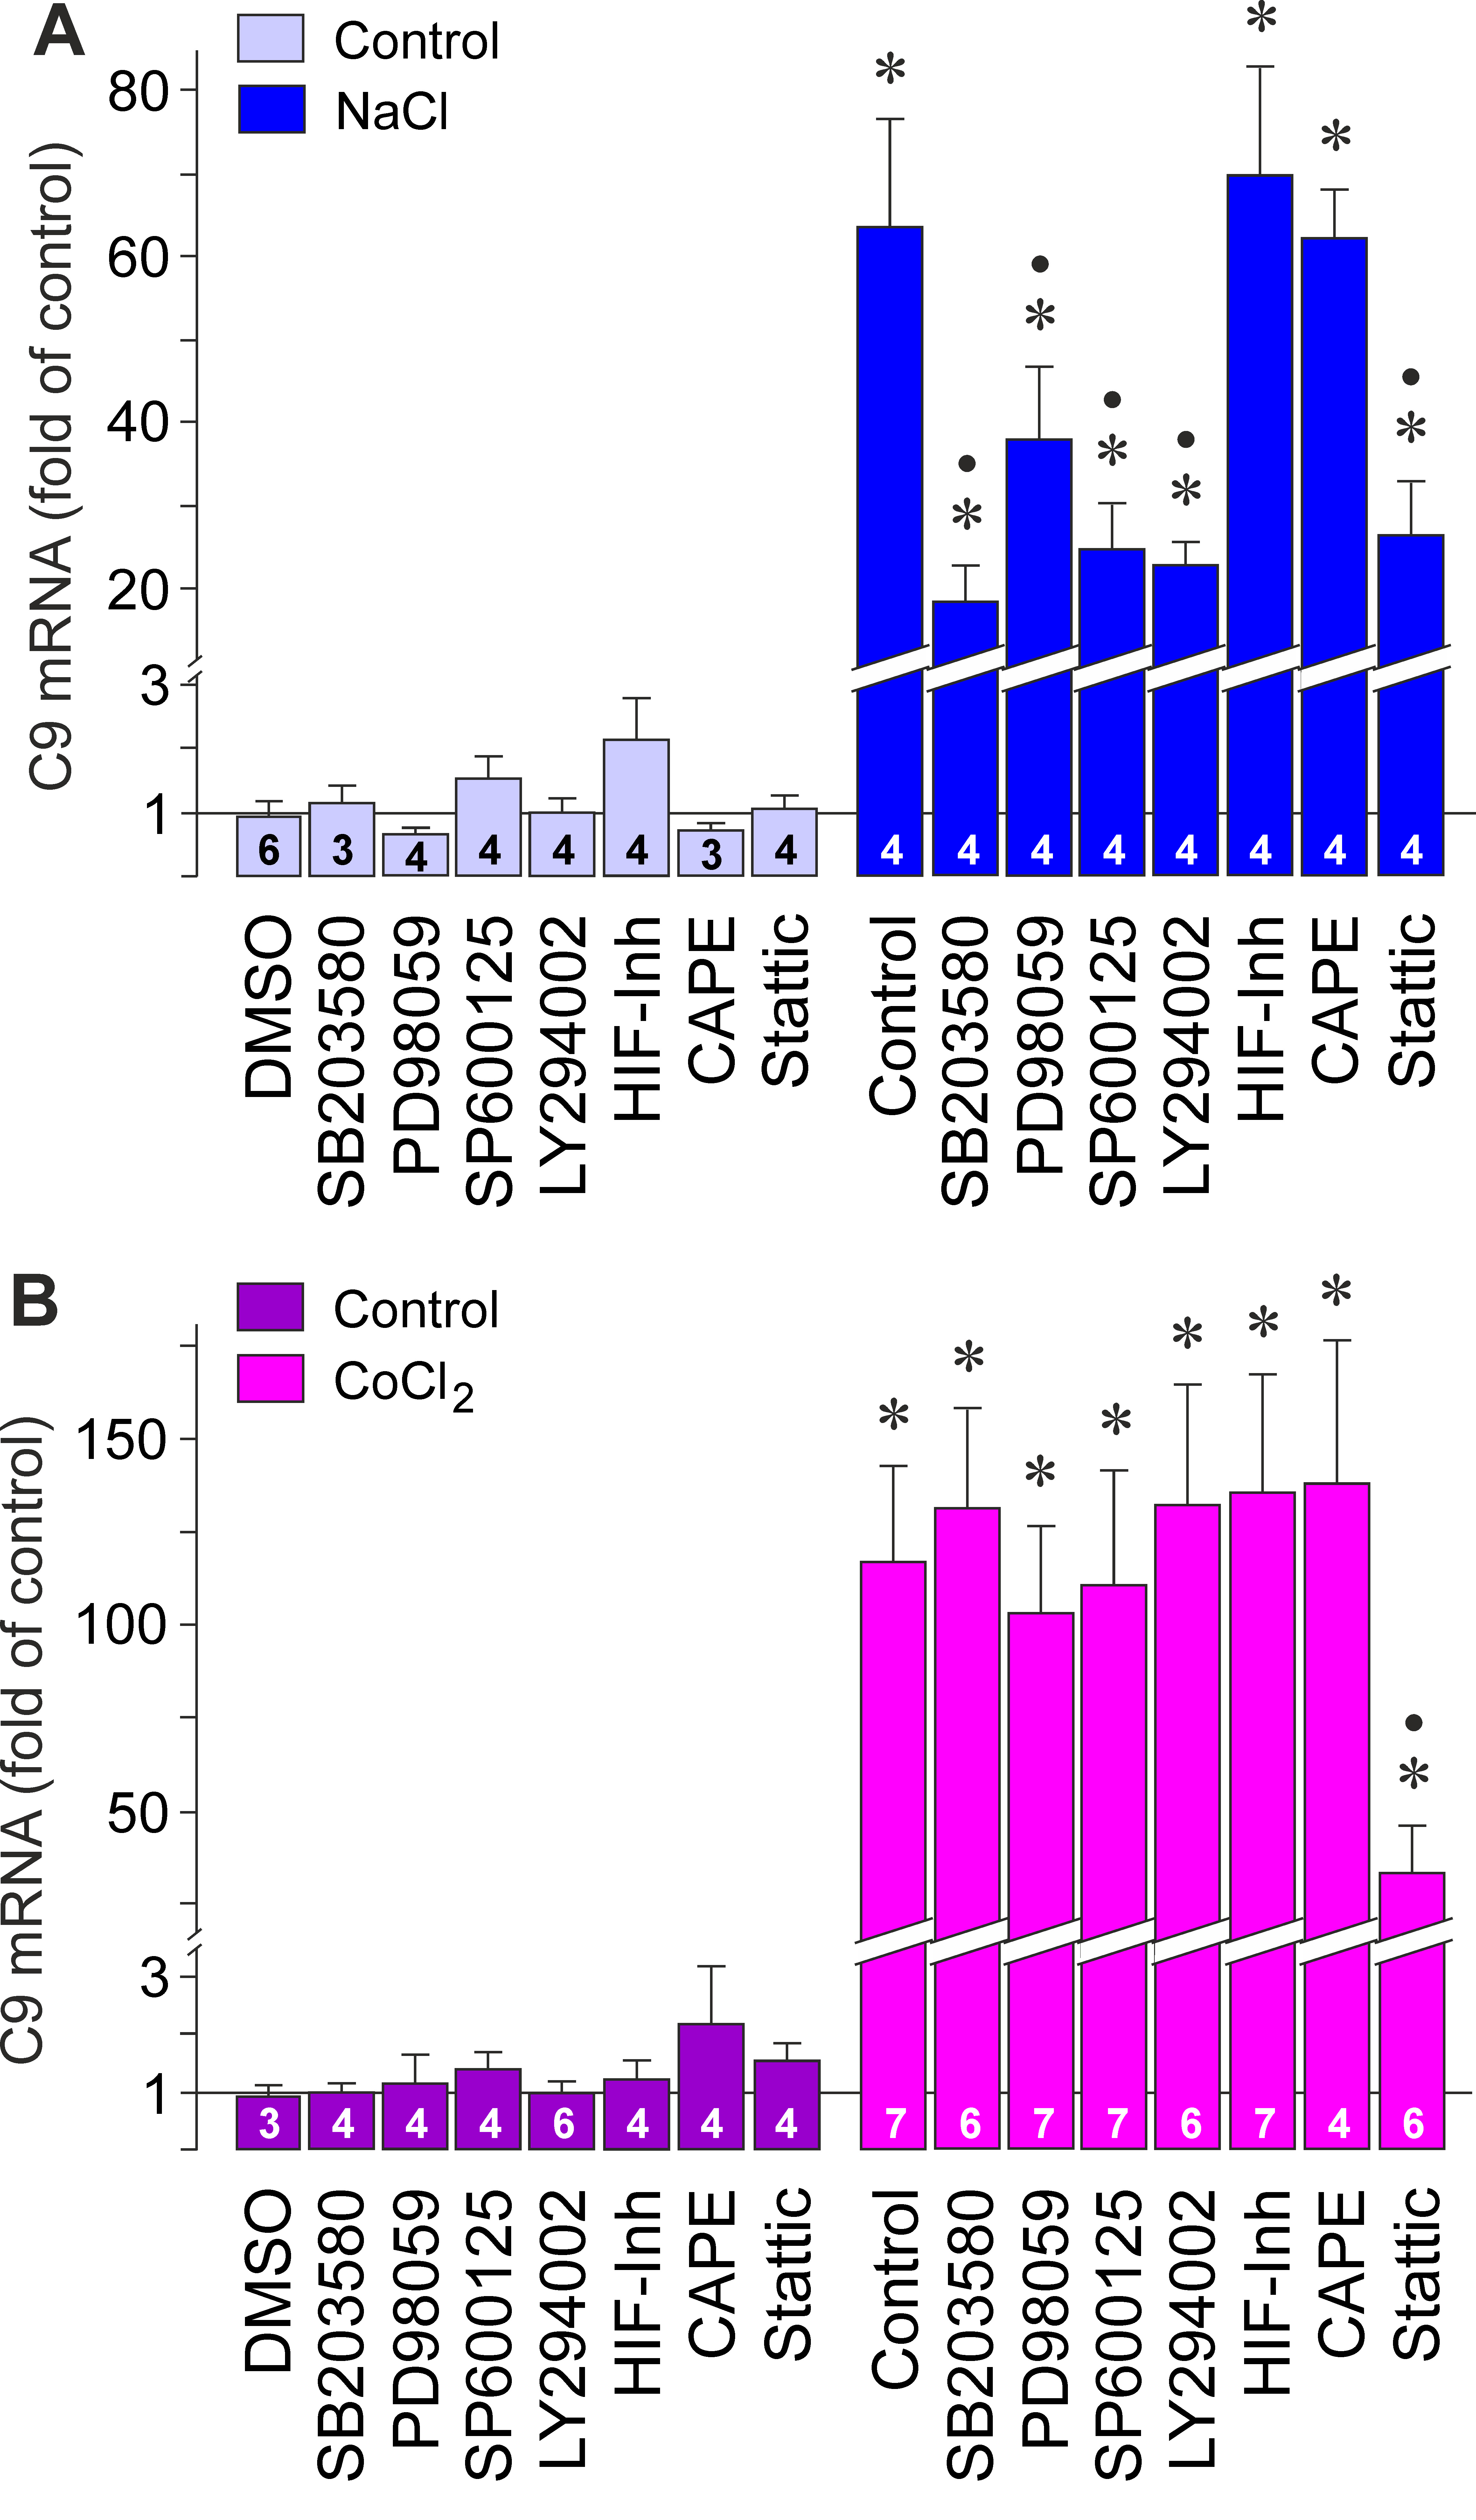
 Figure 4 of
Hollborn, Mol Vis 2018; 24:518-535.
Figure 4 of
Hollborn, Mol Vis 2018; 24:518-535.