Figure 6. Effect of MgAT and TAU on NMDA-induced retinal cell apoptosis. A: Terminal deoxynucleotidyl transferase-mediated dUTP nick end labeled (TUNEL) stained retinal microphotographs. Green fluorescence
shows the apoptotic signals (shown by arrow). Scale bar represents 50 μm. B: Quantitative estimation of the effect of MgAT and TAU on NMDA-induced retinal cell apoptosis in the IR is also shown graphically.
Pre, Co, and Post indicate that MgAT/TAU were injected 24 h before, simultaneously, or 24 h after intravitreal administration
of NMDA, respectively. *p<0.05 versus the NMDA-treated group,***p<0.001 versus the PBS-treated group, #p<0.05 versus the NMDA-treated
group, ###p<0.001 versus NMDA, $p=0.045 corresponding MgAT versus TAU groups, n=6; bars represent mean ± SD. NMDA: N-methyl-D-aspartic
acid, MgAT: Magnesium acetyl taurate, TAU: Taurine, GCL: Ganglion cell layer.
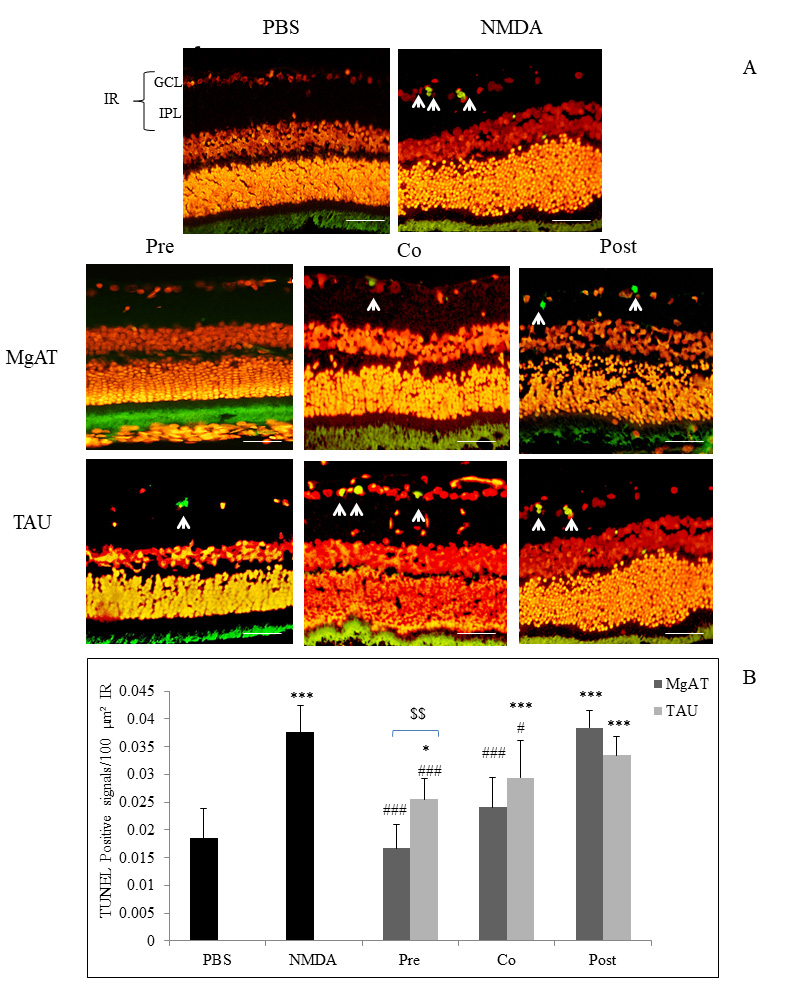
 Figure 6 of
Jafri, Mol Vis 2018; 24:495-508.
Figure 6 of
Jafri, Mol Vis 2018; 24:495-508.