Figure 5. Quantitative estimation of the effect of MgAT and TAU on NMDA-induced changes in retinal morphology. Upper panel shows the
effect of MgAT and TAU on NMDA-induced changes in the thickness of the GCL (%) within IR while the lower panel shows the effects
of same on numeric density of the retinal cell nuclei in IR. Pre, Co, and Post indicate that MgAT/TAU were injected 24 h before,
simultaneously, or 24 h after intravitreal administration of NMDA, respectively. NMDA: N-methyl-D-aspartic acid; MgAT: Magnesium
acetyltaurate; TAU: Taurine; GCL: Ganglion cell layer; IR: Inner retina ***p<0.001 versus the PBS-treated group; #p<0.05 versus
the NMDA-treated group; ##p<0.01 versus the NMDA-treated group; ###p<0.001 versus the NMDA-treated group; $p=0.045 corresponding
MgAT versus TAU groups, N=6; Bars represent mean ± SD.
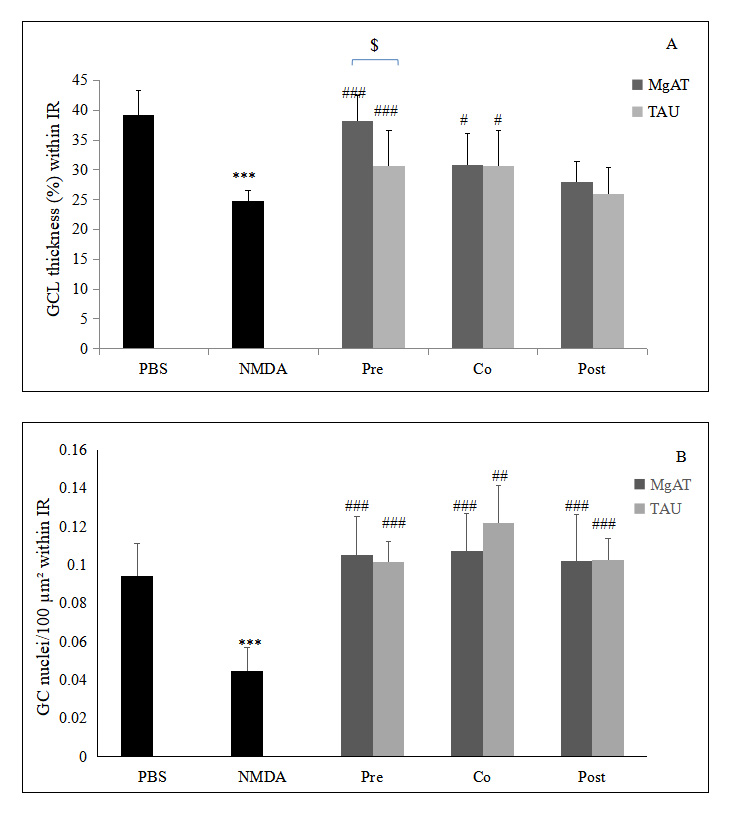
 Figure 5 of
Jafri, Mol Vis 2018; 24:495-508.
Figure 5 of
Jafri, Mol Vis 2018; 24:495-508.