Figure 2. Effect of MgAT and TAU on NMDA-induced changes in iNOS expression. A: Microphotographs of retinal sections immunostained with iNOS antibodies showing the effect of MgAT and TAU on the NMDA-induced
increase in the expression of iNOS (20X). Green fluorescence shows iNOS expression stained with FITC (shown by arrow) while
blue fluorescence shows retinal nuclei stained with 4′,6-diamidino-2-phenylindole (DAPI). Scale bar represents 50 μm. B: Quantitative estimation of the effect of MgAT and TAU on the NMDA-induced increase in the expression of iNOS is also represented
graphically. Pre, Co, and Post indicate that MgAT/TAU were injected 24 h before, simultaneously, or 24 h after intravitreal
administration of NMDA, respectively. ***p<0.001 versus the PBS-treated group, ##p<0.01 versus the NMDA-treated group, ###p<0.001
versus the NMDA-treated group, $p<0.05 corresponding MgAT versus TAU groups, n=6; bars represent mean ± SD. NMDA: N-methyl-D-aspartic
acid, MgAT: Magnesium acetyl taurate, TAU: Taurine, GCL: Ganglion cell layer.
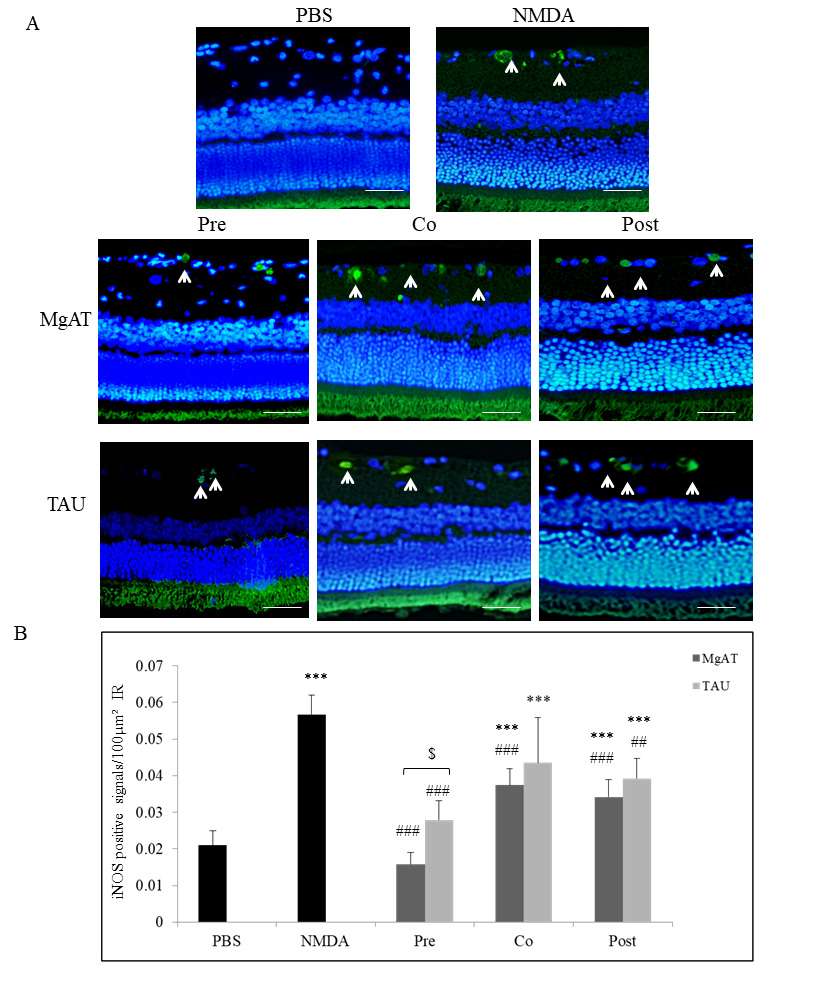
 Figure 2 of
Jafri, Mol Vis 2018; 24:495-508.
Figure 2 of
Jafri, Mol Vis 2018; 24:495-508.