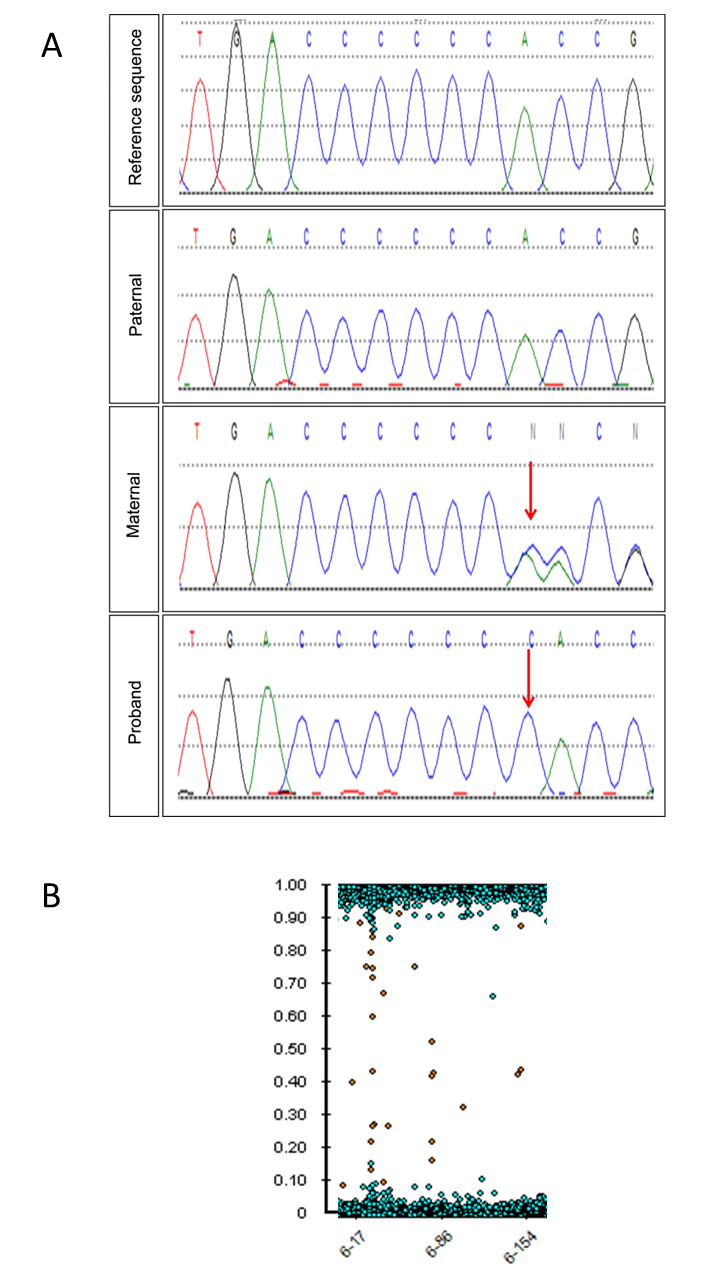
Figure 3. Genetic analysis of the proband.
A: Sanger sequencing electropherograms showing (top to bottom)
TULP1 reference sequence (
NM_003322.3), paternal electropherogram showing wild-type sequence, maternal electropherogram revealing heterozygous duplication, c.524dupC
(arrow), and proband electropherogram showing homozygous duplication (arrow) of the preceding C nucleotide.
B: Single nucleotide polymorphism (SNP) array showing the absence of heterozygous calls on chromosome 6, corresponding to uniparental
isodisomy.
 Figure 3 of
Souzeau, Mol Vis 2018; 24:478-484.
Figure 3 of
Souzeau, Mol Vis 2018; 24:478-484.