Figure 2. Phylogenetic analysis of Dscam and Sdk amino acid sequences of selected vertebrates. Individual maximum likelihood trees were
generated by RaxML under the model gamma blosum62. Bootstrap support from maximum-likelihood analysis is shown at each node.
Orthologs corresponding to DSCAM, DSCAML1, SDK1, and SDK2 from zebrafish (Danio rerio), medaka (Oryzias latipes), tilapia (Oreochromis niloticus), threespine stickleback (Gasterosteus aculeatus), cod (Gadus morhua), humans (Homo sapiens), mice (Mus musculus), chickens (Gallus gallus), and spotted gar (Lepisosteus oculatos) were used for the analysis. Roots are placed in non-fish vertebrates. Maximum likelihood trees for A) DSCAM B), DSCAML1 C), SDK1, and D) SDK2 orthologs are shown. The scale bar at the bottom indicates substitutions per site. The numbers at branch points indicate
bootstrapping values. Abbreviations: Dscam=Down syndrome cell adhesion molecule; Sdk=sidekick.
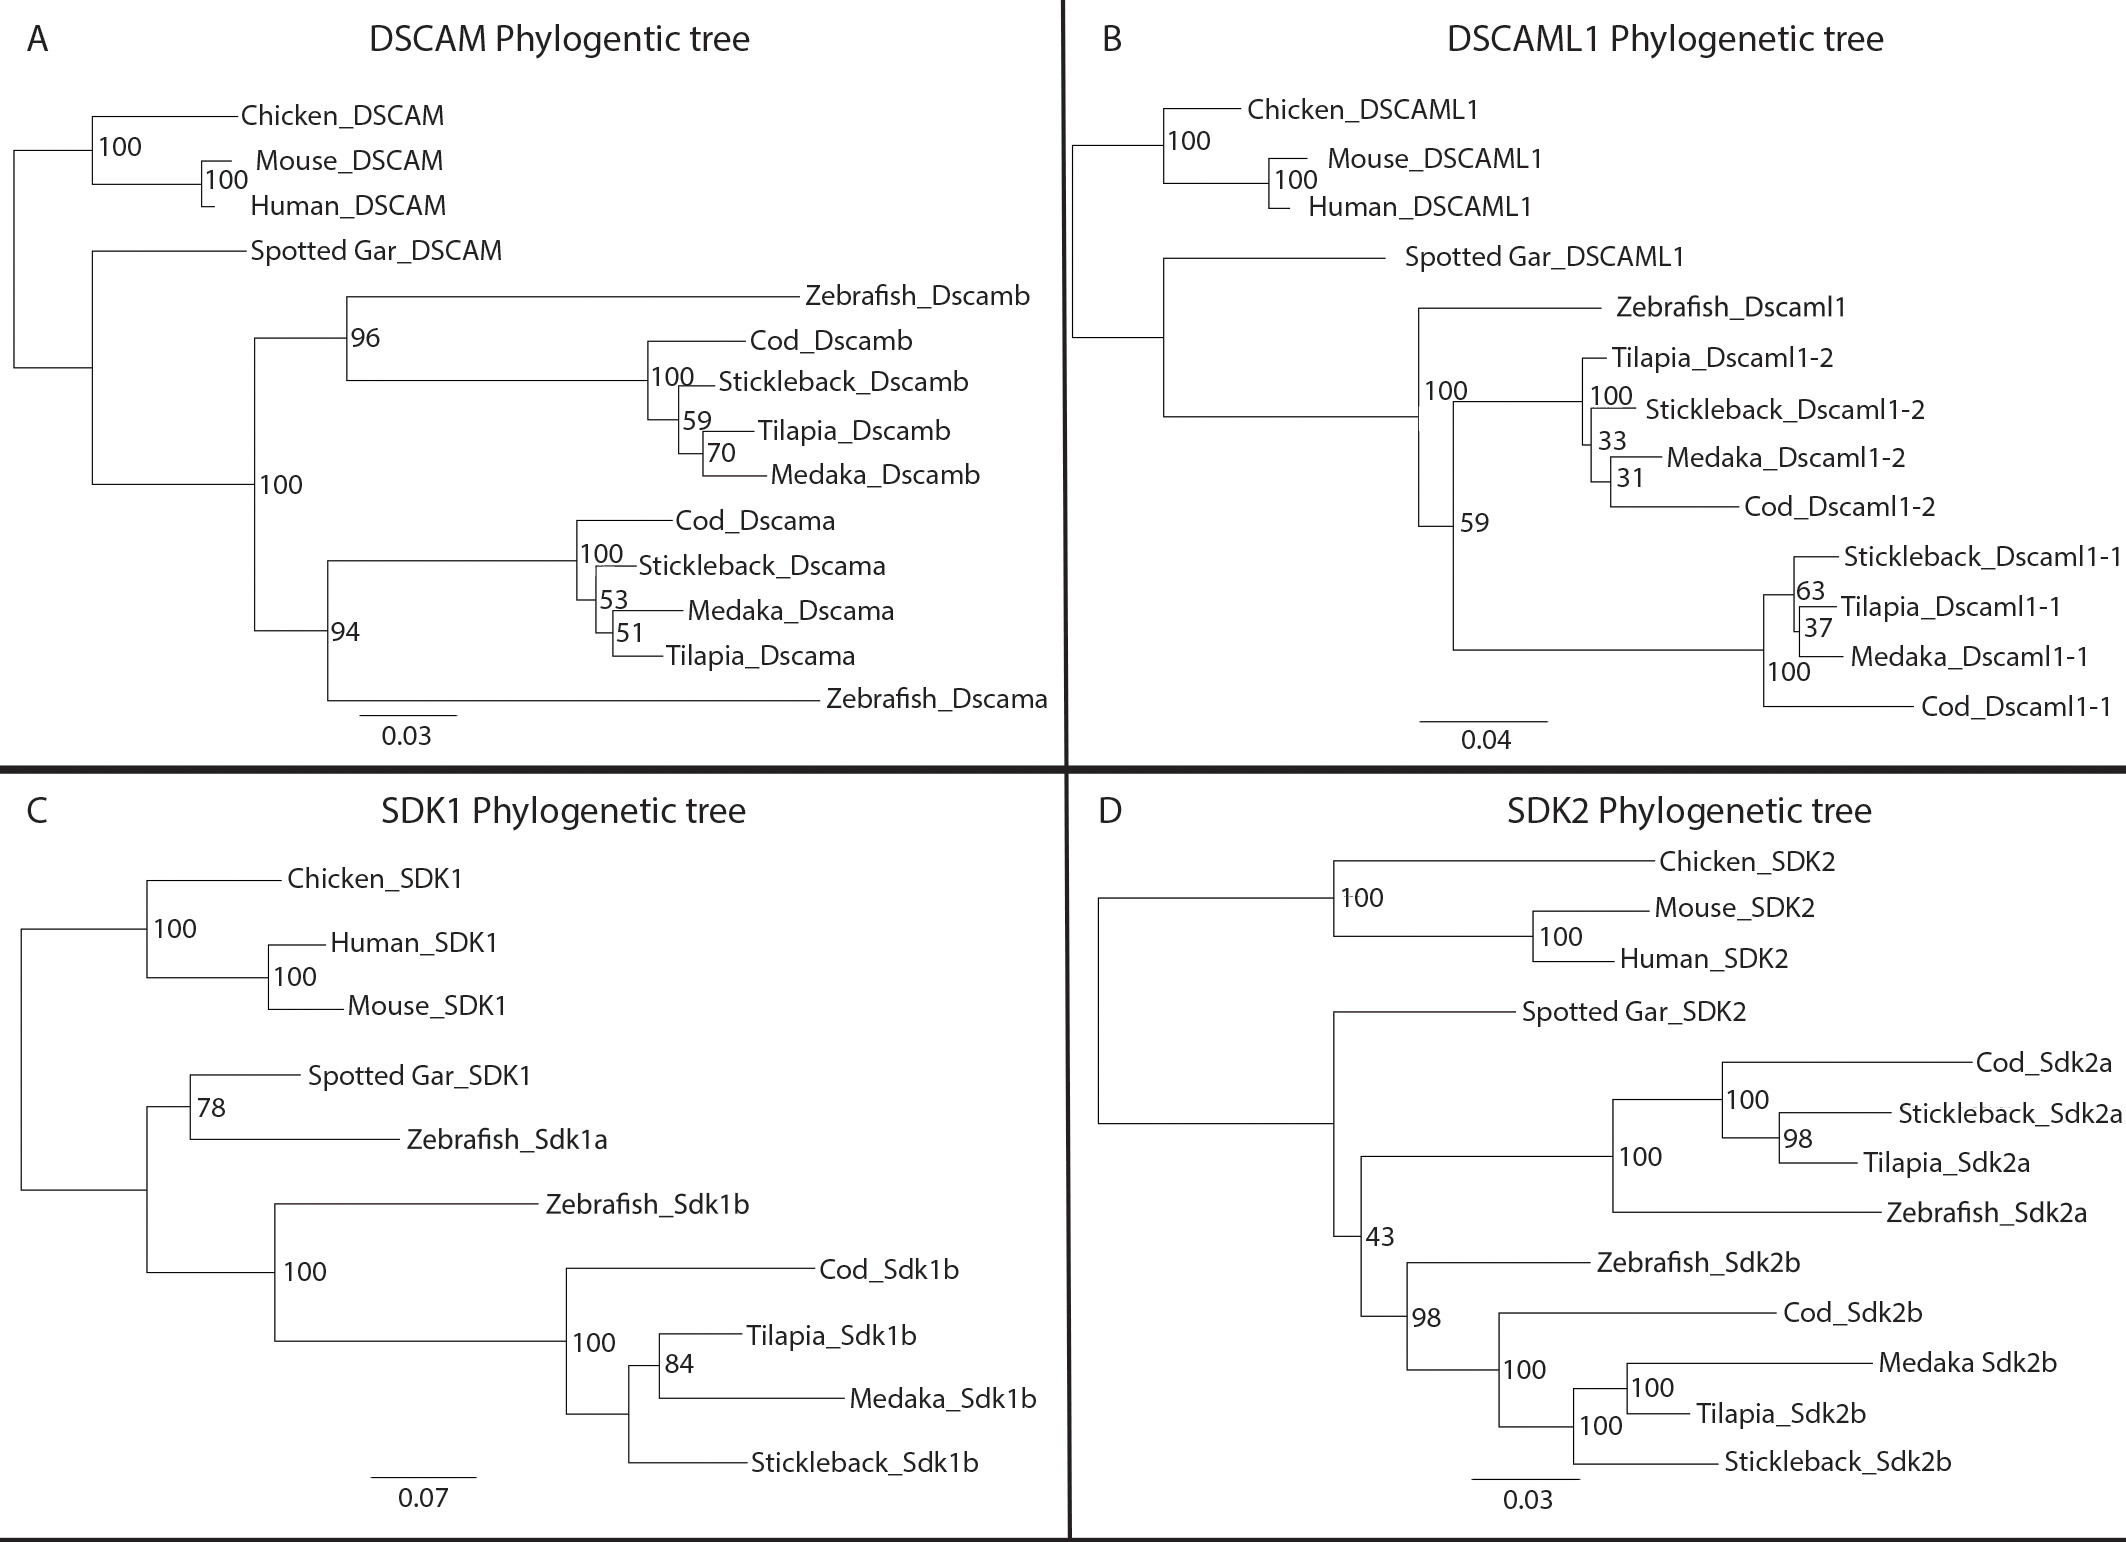
 Figure 2 of
Galicia, Mol Vis 2018; 24:443-458.
Figure 2 of
Galicia, Mol Vis 2018; 24:443-458.