Figure 3. Enhanced respiratory capacity of polarized hfRPE cells compared to replated controls. A: Pictorial representation of a mitochondrial stress test and respiration parameters calculated. B: Paired wells of a single human fetal RPE (hfRPE) cell line were subjected to mitochondrial stress tests on an XFp Analyzer
with two different methods. Triplicate samples of polarized cells excised from a Transwell filter (green) were compared to
triplicate samples trypsinized from a Transwell filter and replated in a miniplate (black). C: Respiration parameters calculated from the mitochondrial stress test. D: Basal extracellular acidification rate (ECAR) values obtained during the mitochondrial stress test revealed a statistically
significant difference between replated and insert hfRPE, and differences in the OCR/ECAR ratios (E). ****p<0.0001. Results are expressed as mean ± standard deviation.
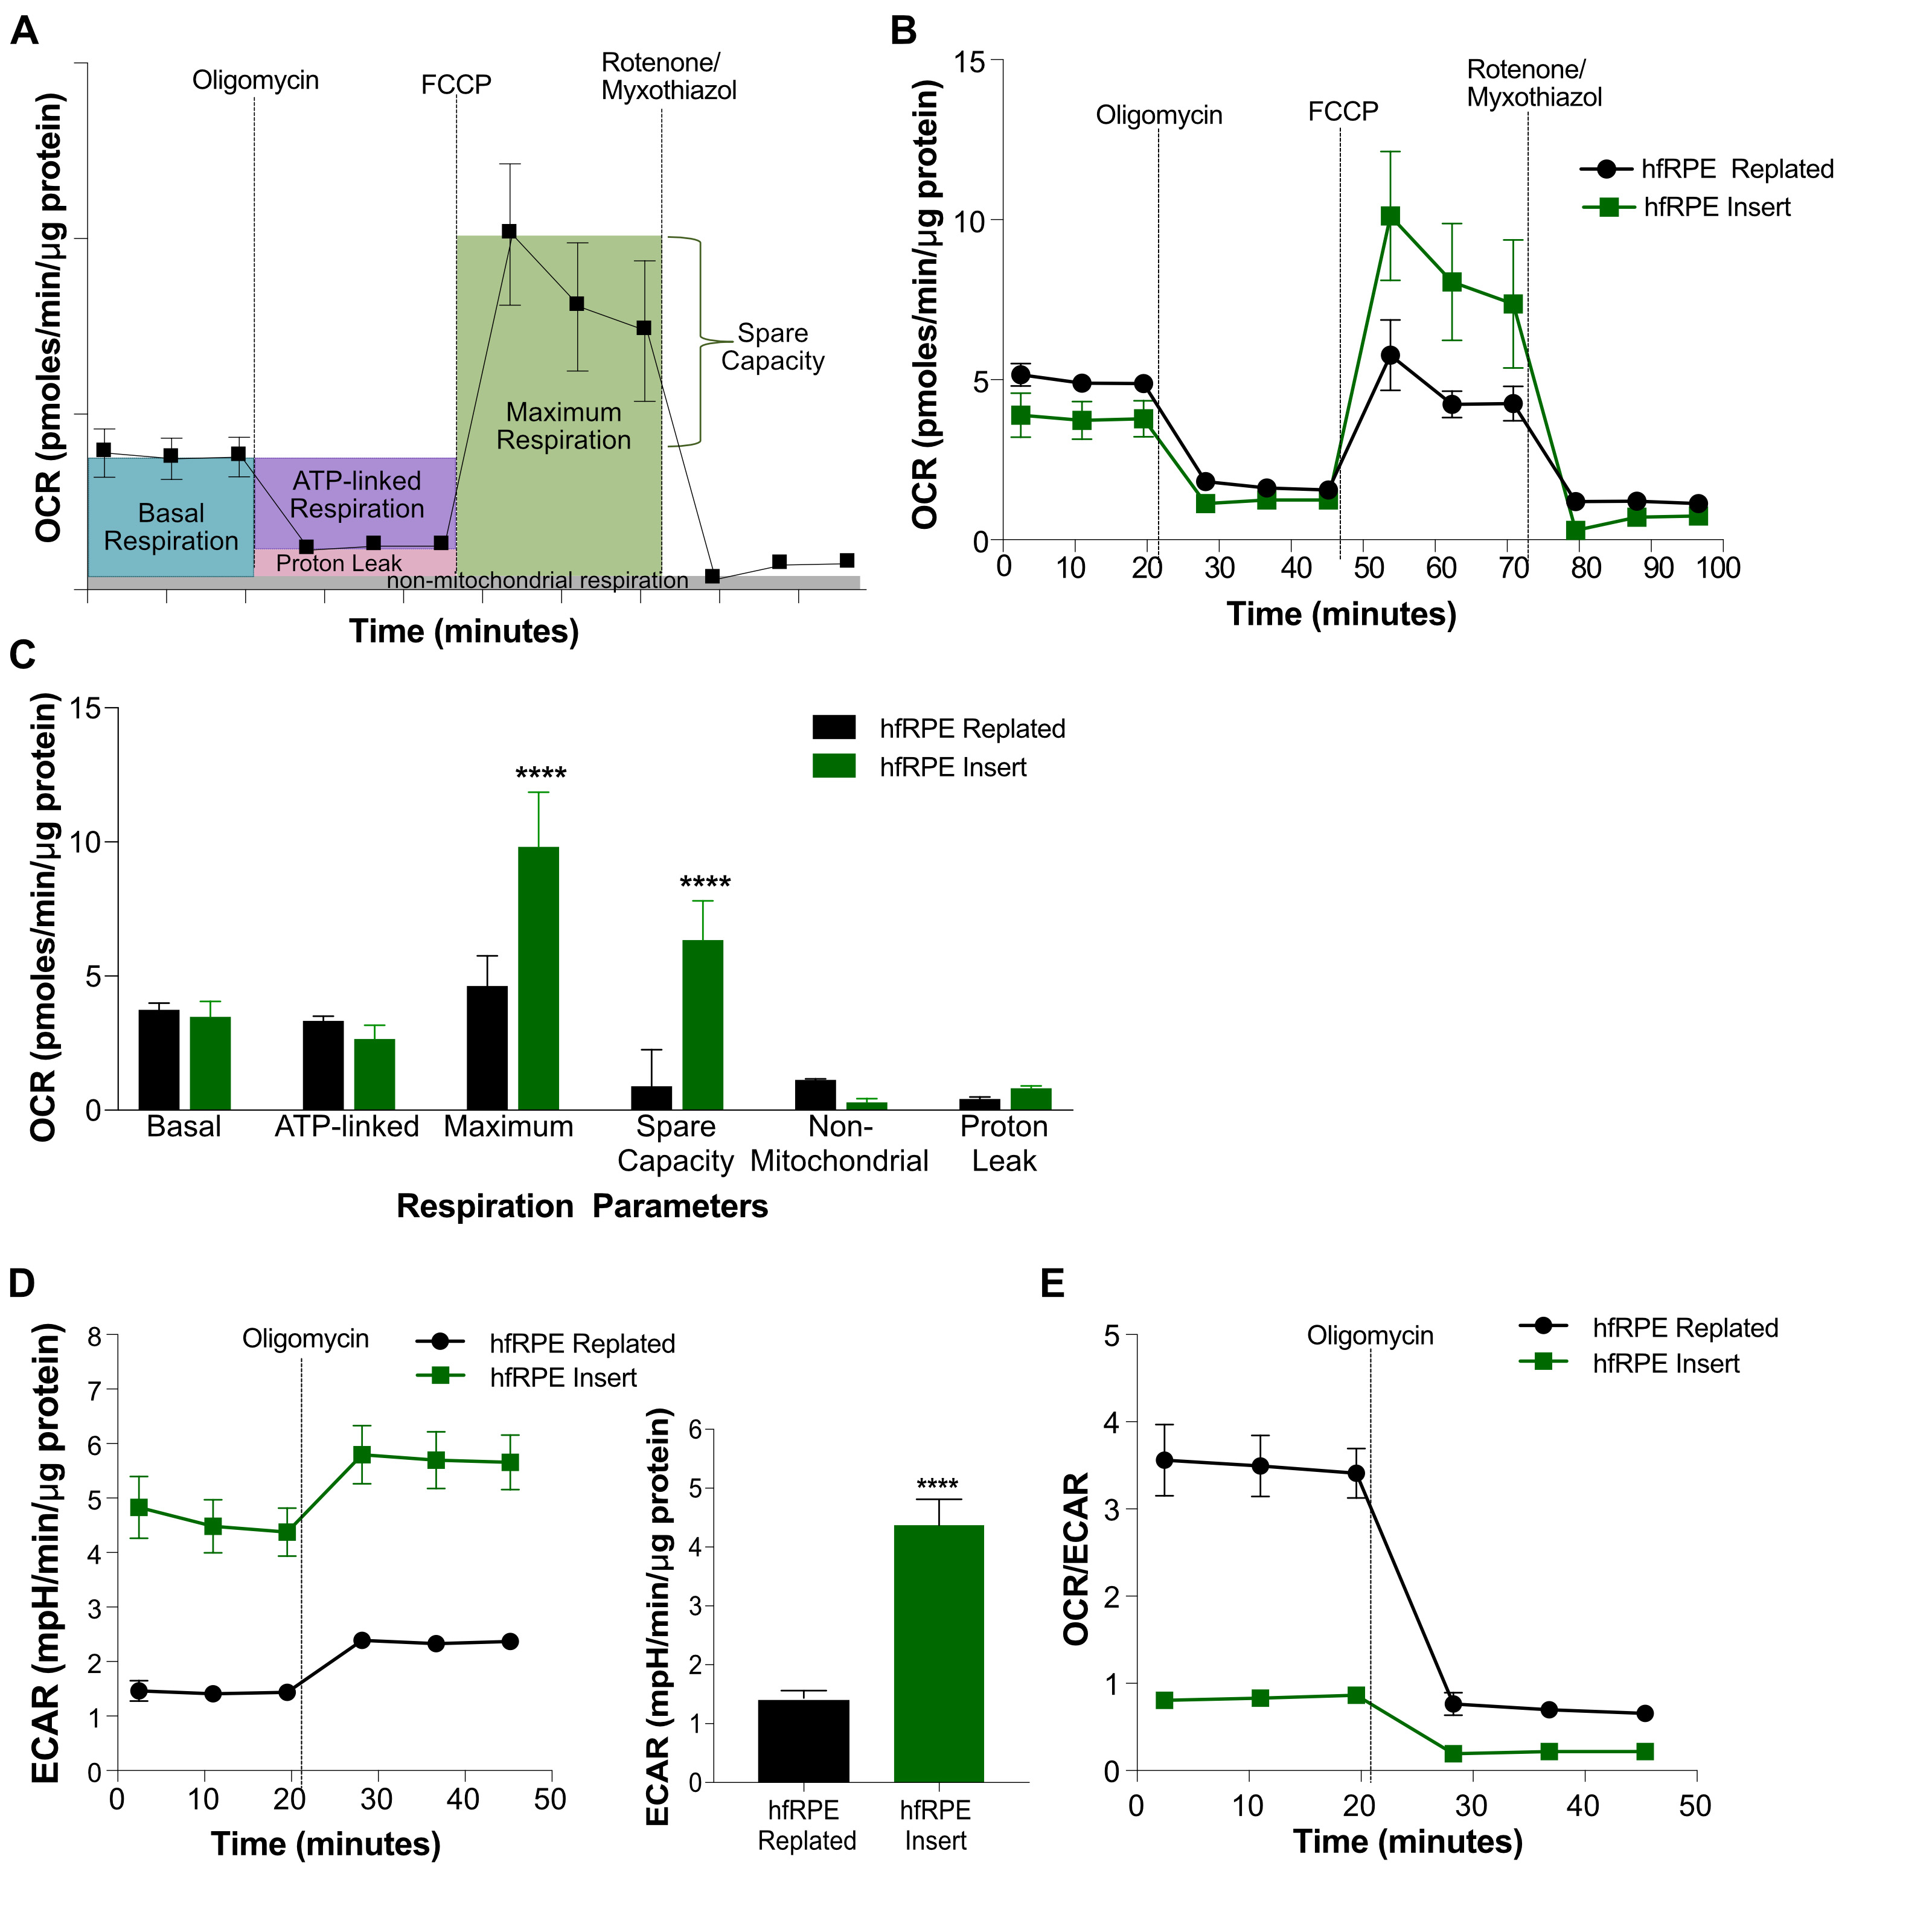
 Figure 3 of
Calton, Mol Vis 2018; 24:425-433.
Figure 3 of
Calton, Mol Vis 2018; 24:425-433.