Figure 2. Box-whisker plots showing levels of inflammatory factor expression in different congenital cataract morphology subgroups.
Solid horizontal lines indicate the median and the 25th–75th interquartile range level. A Kruskal–Wallis test with a post
hoc Mann–Whitney test was performed between groups, and a statistically significant difference was accepted at p<0.0125 by
Bonferroni correction.
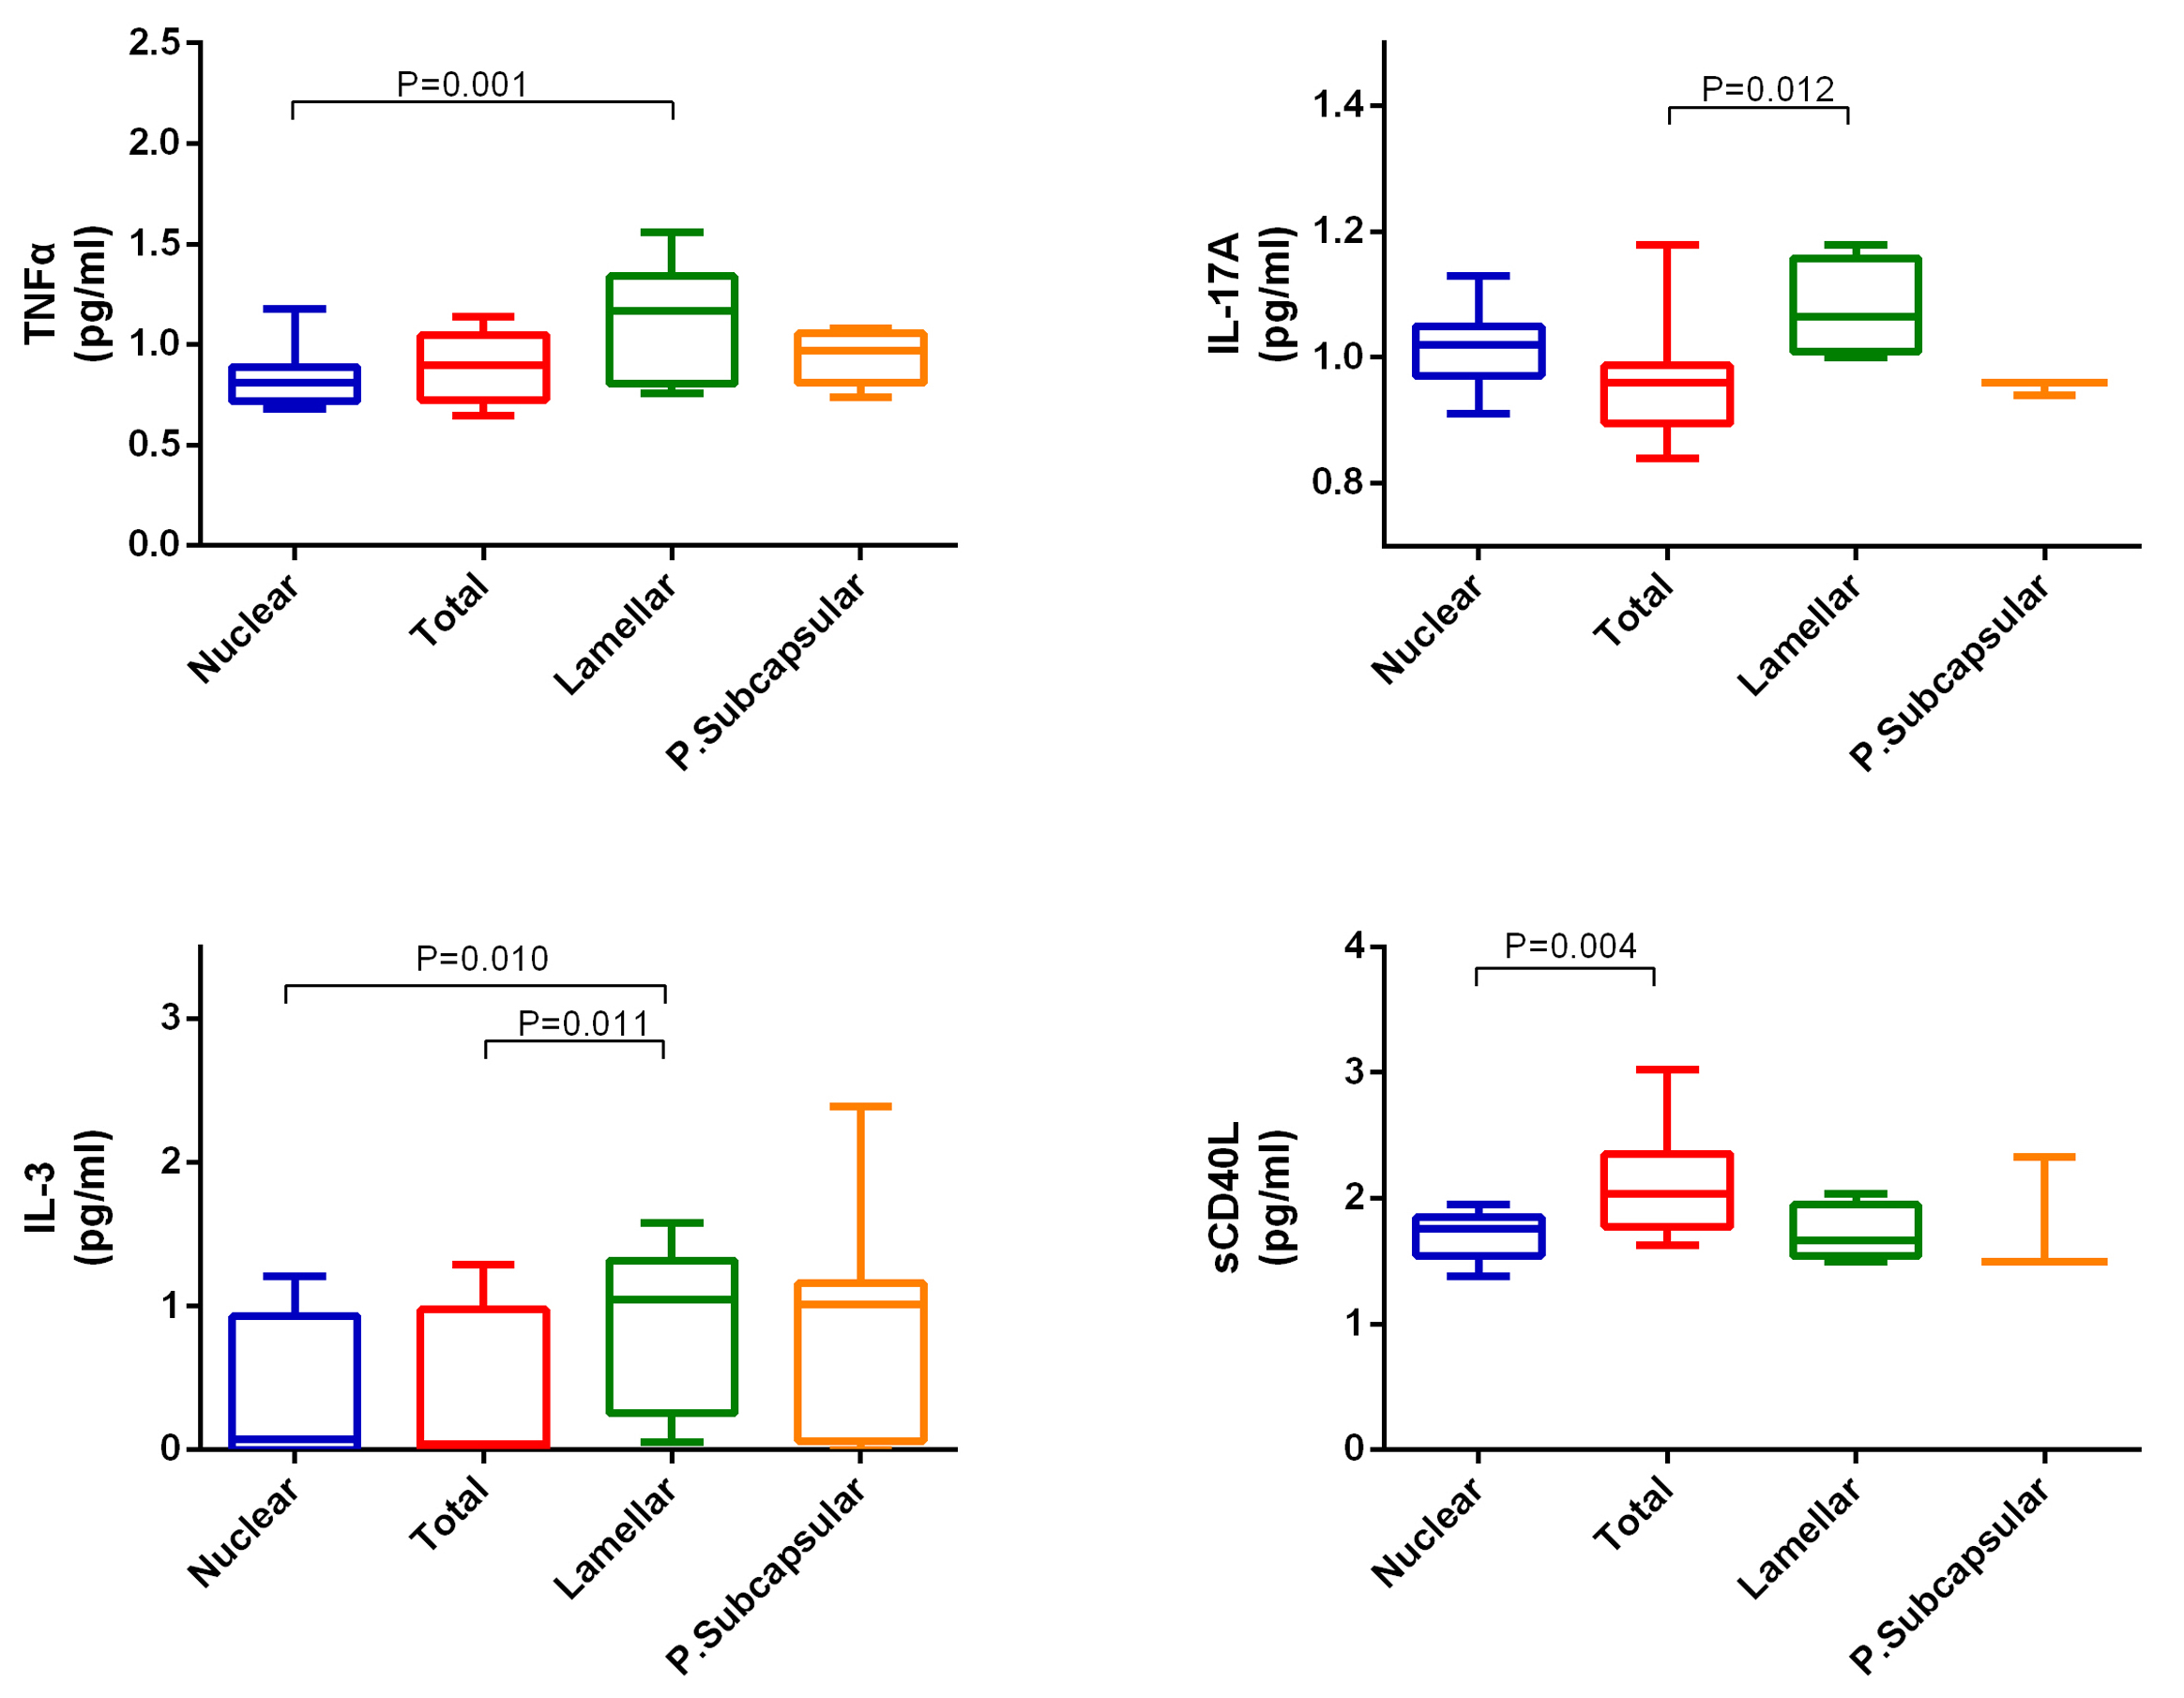
 Figure 2 of
Wu, Mol Vis 2018; 24:414-424.
Figure 2 of
Wu, Mol Vis 2018; 24:414-424.