Figure 4. RIP3 and RIP1. A: Western blot of RIP3 and RIP1 in eye-cups and retinas from normal, MOCK-infected (CTR) and MCMV-injected IS (MCMV) mice
at day 10 p.i. B: Ratio of RIP3 and cleaved RIP1 to β-actin. Data are shown as mean ± SEM (n = 8) and compared by a t-test (and nonparametric
test). ****p < 0.0001, ***p < 0.001. N.S. = Not significant.
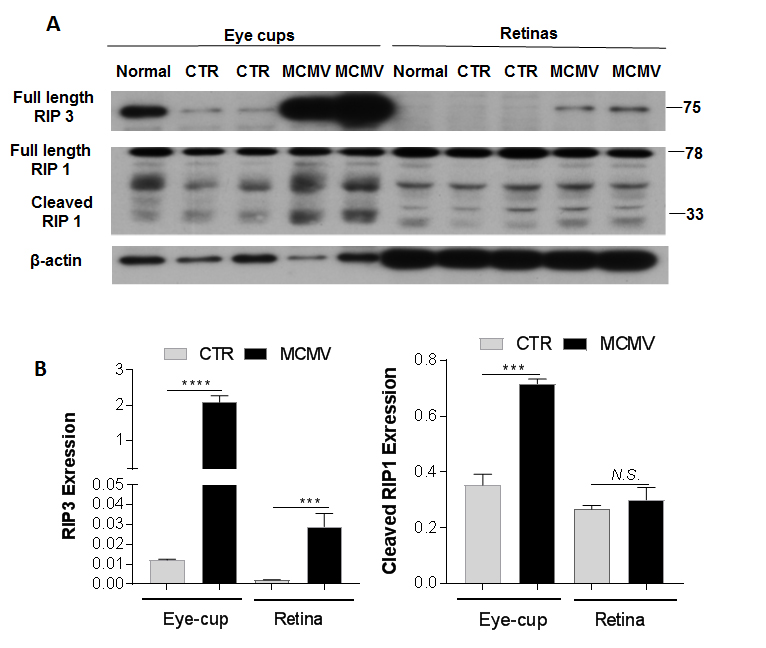
 Figure 4 of
Xu, Mol Vis 2018; 24:379-394.
Figure 4 of
Xu, Mol Vis 2018; 24:379-394.