Figure 5. Electroretinography of the different groups before and after the I/R insult. A, B: Graphic demonstrating the electroretinography (ERG) component (a-wave, b-wave, and photopic-negative response [PhNR]). C: PhNR amplitudes at photopic 3 cd s/m2 (n=15). D, E: Mean amplitudes of saturated ERG responses, presented as the relative change from the baseline and normalized to a control
eye at scotopic 3 cd s/m2 (D) and photopic 3 cd s/m2 (E; n=15). F, G: Average latency times of ERG a-waves and b-waves at scotopic 3 cd s/m2 (F) and photopic 3 cd s/m2 (G; n=15). *p<0.05, #p<0.01,**p<0.005.
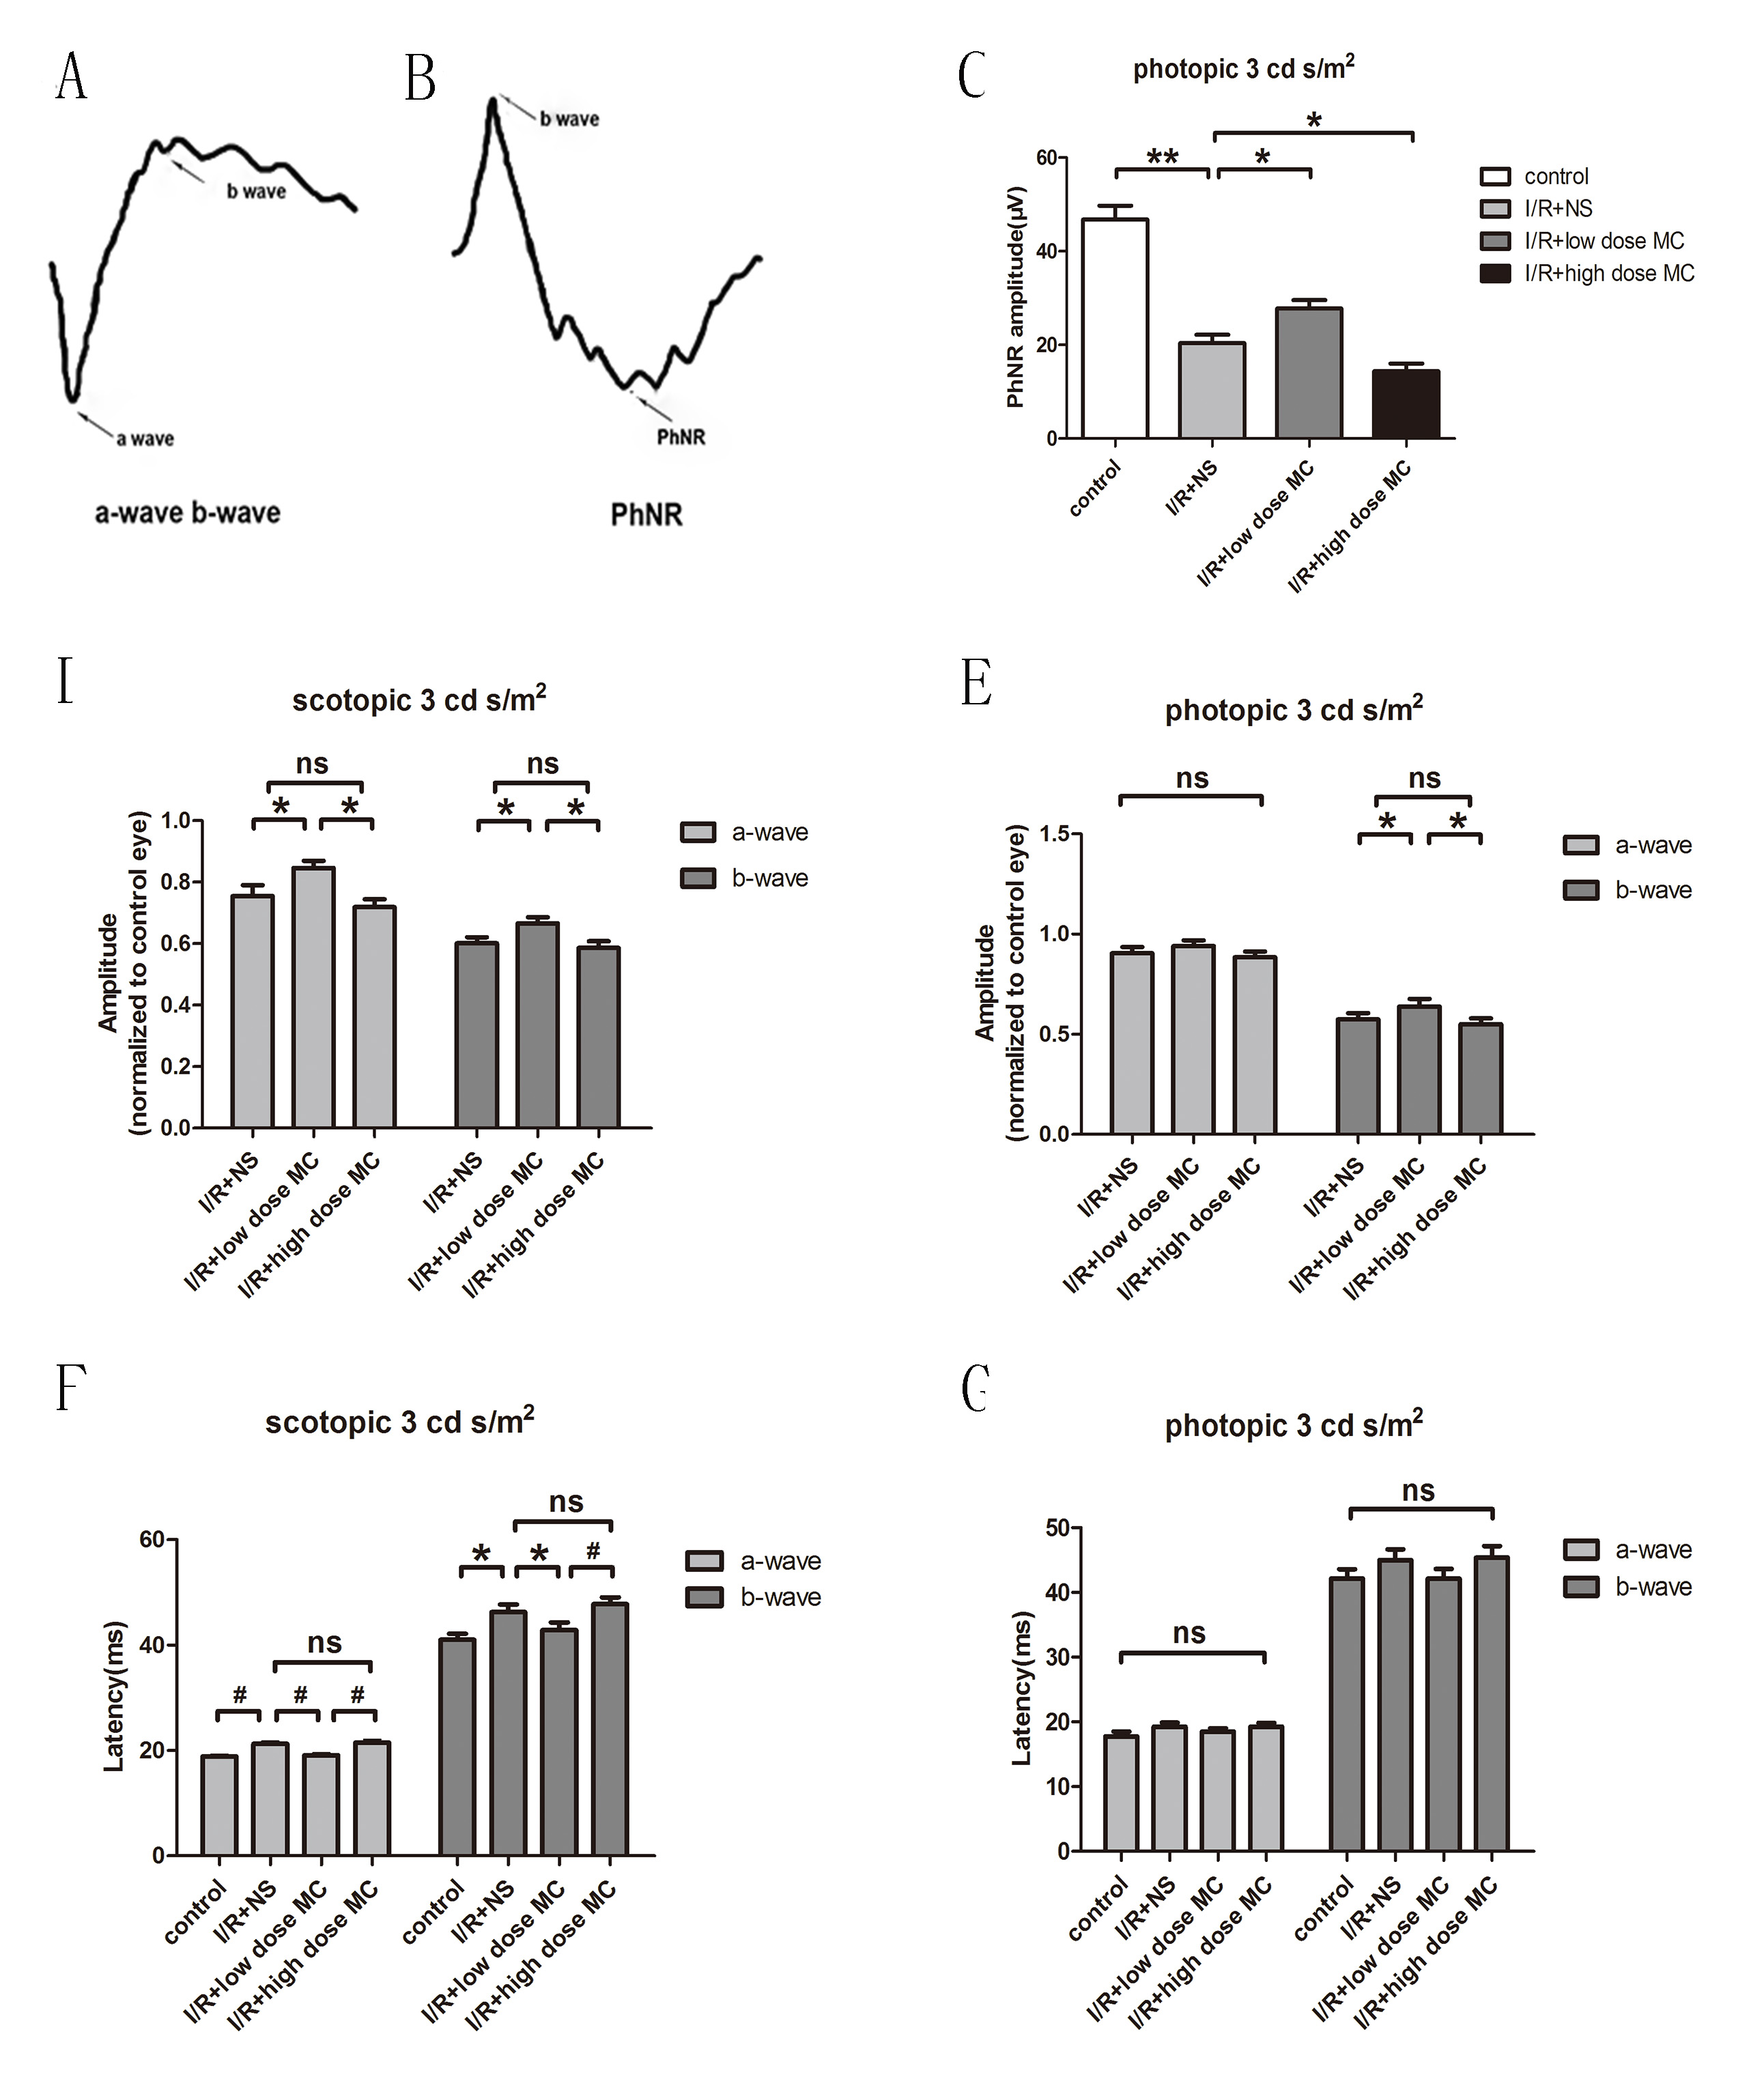
 Figure 5 of
Huang, Mol Vis 2018; 24:367-378.
Figure 5 of
Huang, Mol Vis 2018; 24:367-378.