Figure 4. Minocycline (MC) treatment improved optokinetic responses. A, B: Diagram illustrating the optokinetic testing apparatus. C: Video camera image of a mouse tracking the grating. D: Simple staircase method of measuring the visual acuity threshold in the optokinetic test (n=8). E: Histogram of visual acuity. #p<0.01, **p<0.005.
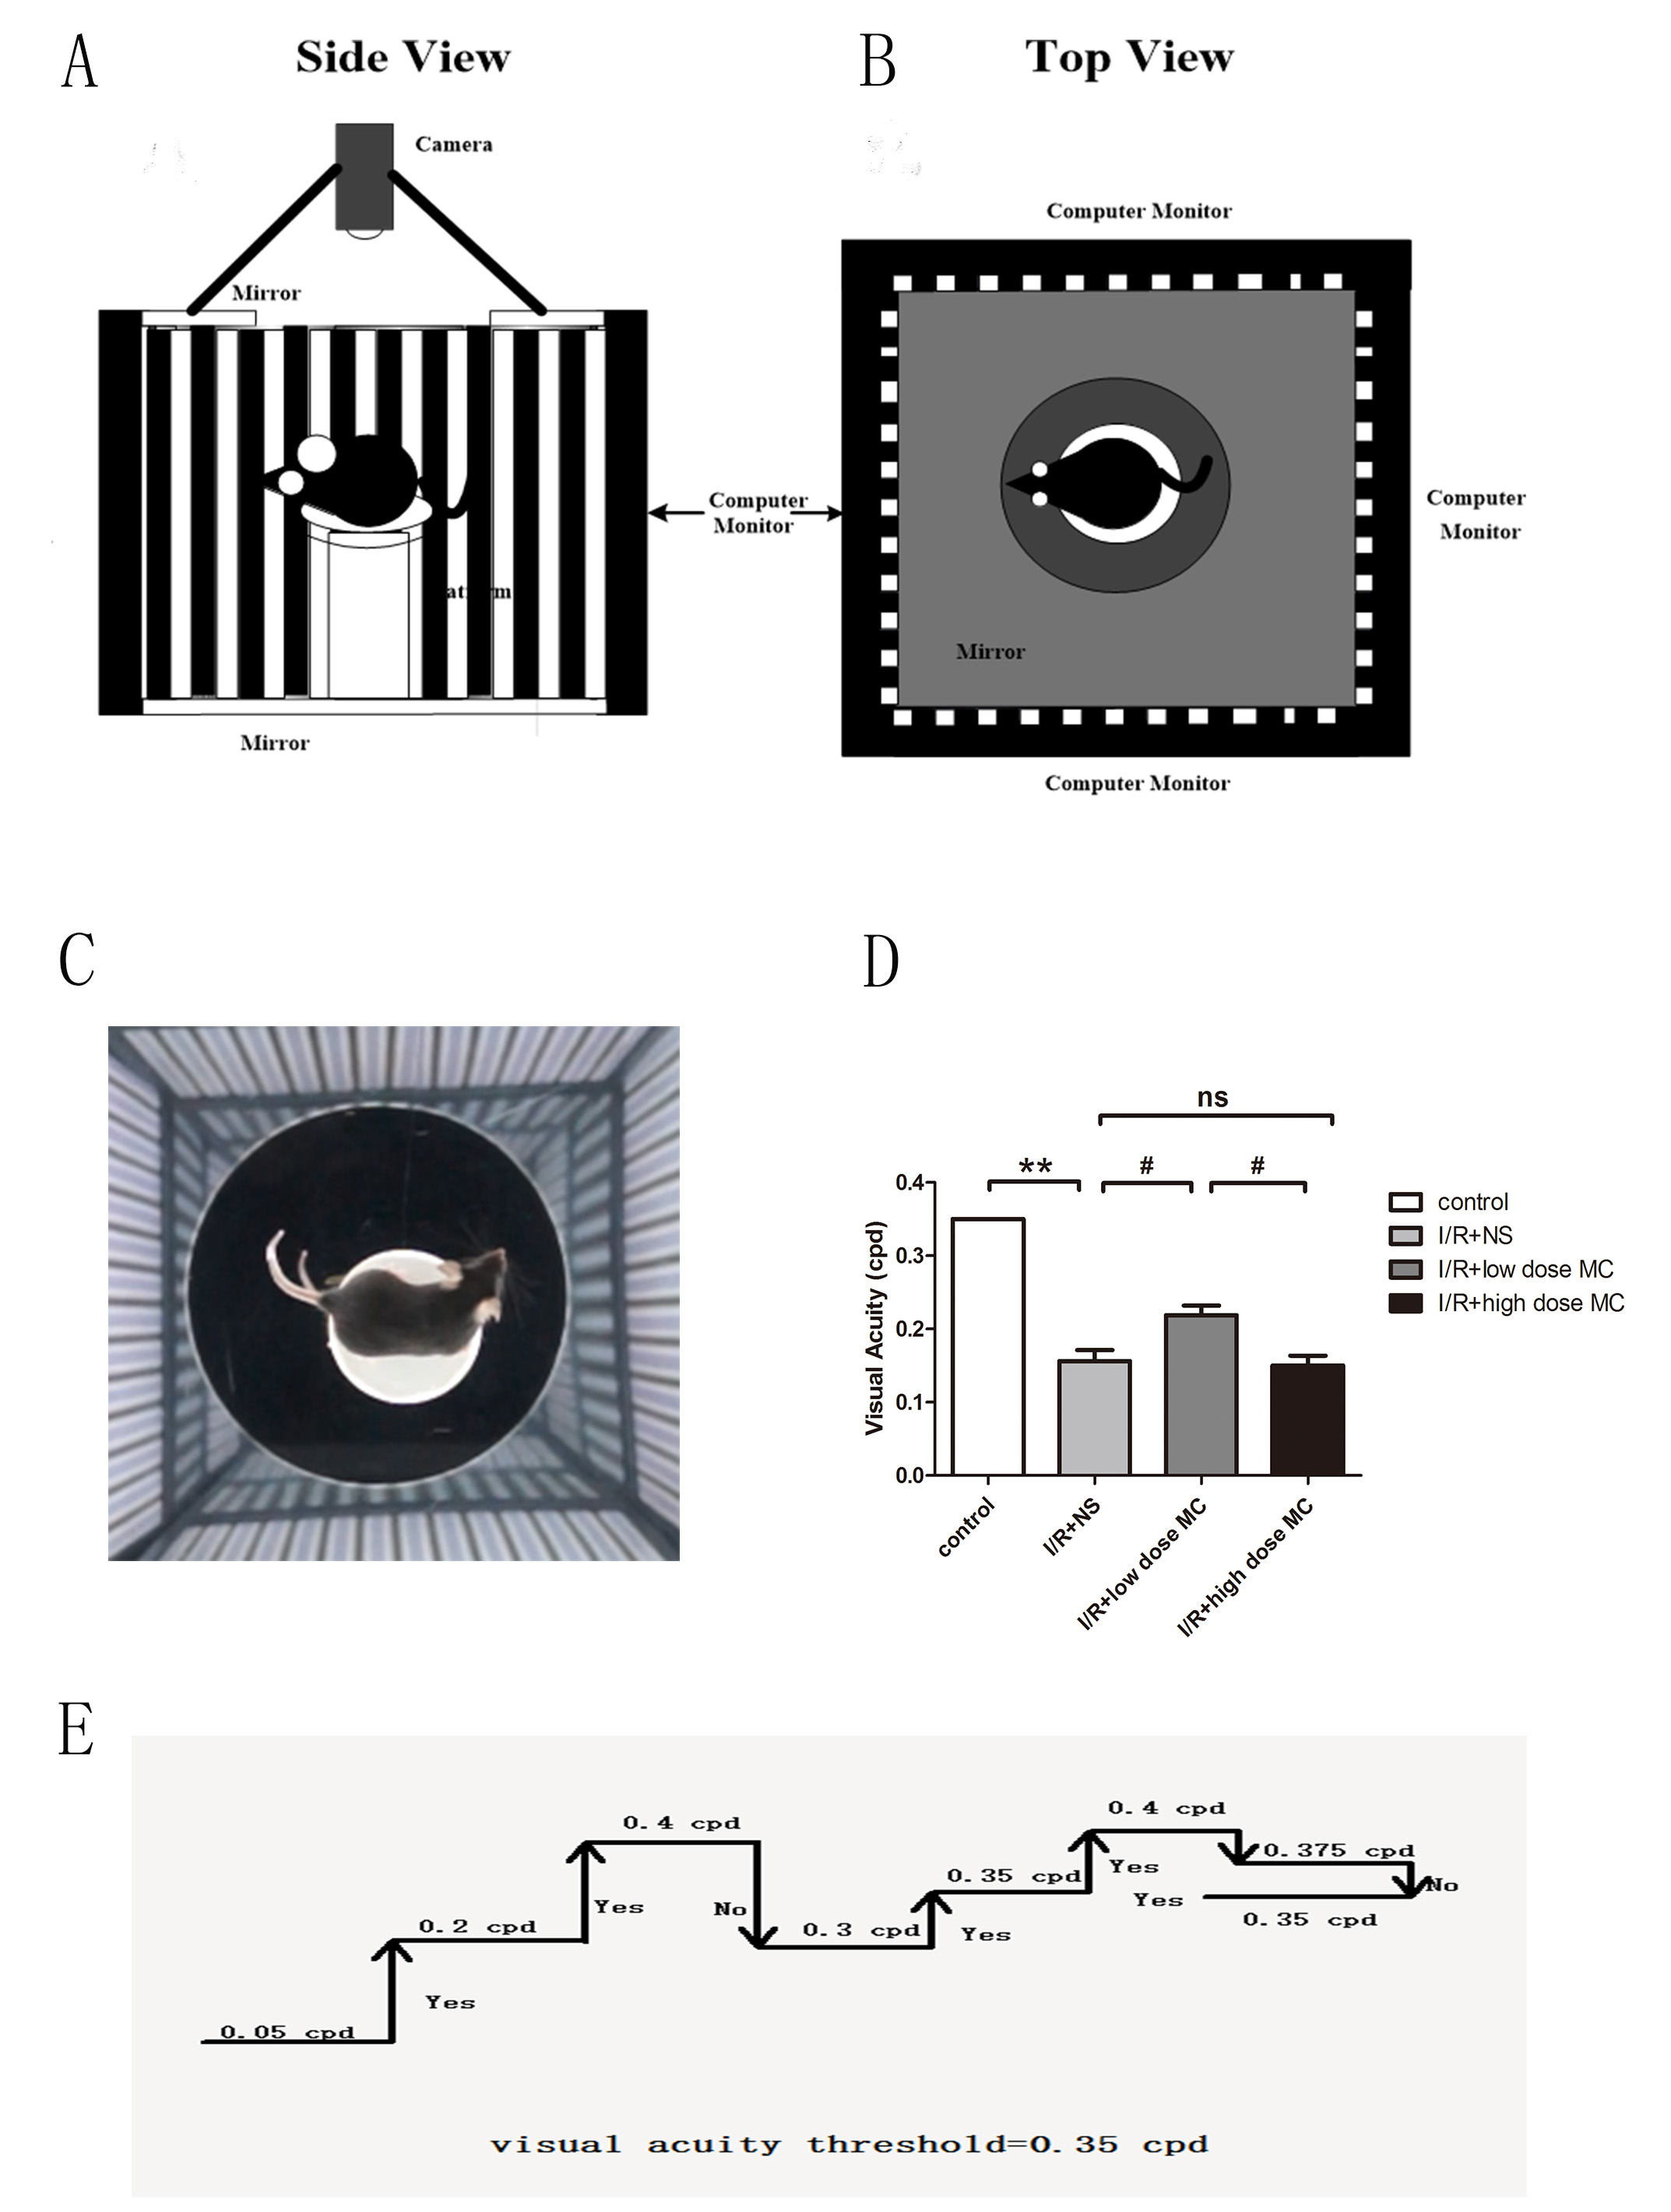
 Figure 4 of
Huang, Mol Vis 2018; 24:367-378.
Figure 4 of
Huang, Mol Vis 2018; 24:367-378.