Figure 2. Change in the inner retinal layer in minocycline-treated retinas after retinal ischemic reperfusion injury. A–D: Photomicrographs demonstrating the hematoxylin and eosin (H&E)-stained retinal section from the middle area in the ischemic-reperfusion
(I/R) injury control group (A), the I/R injury + normal saline (NS) vehicle group (B), the low-dose minocycline (MC) treatment group (C), and the high-dose MC treatment group (D). Scale bar = 50 µm. E: Histogram quantifying the inner retinal layer (IRL) thickness (n=8). **p<0.005.
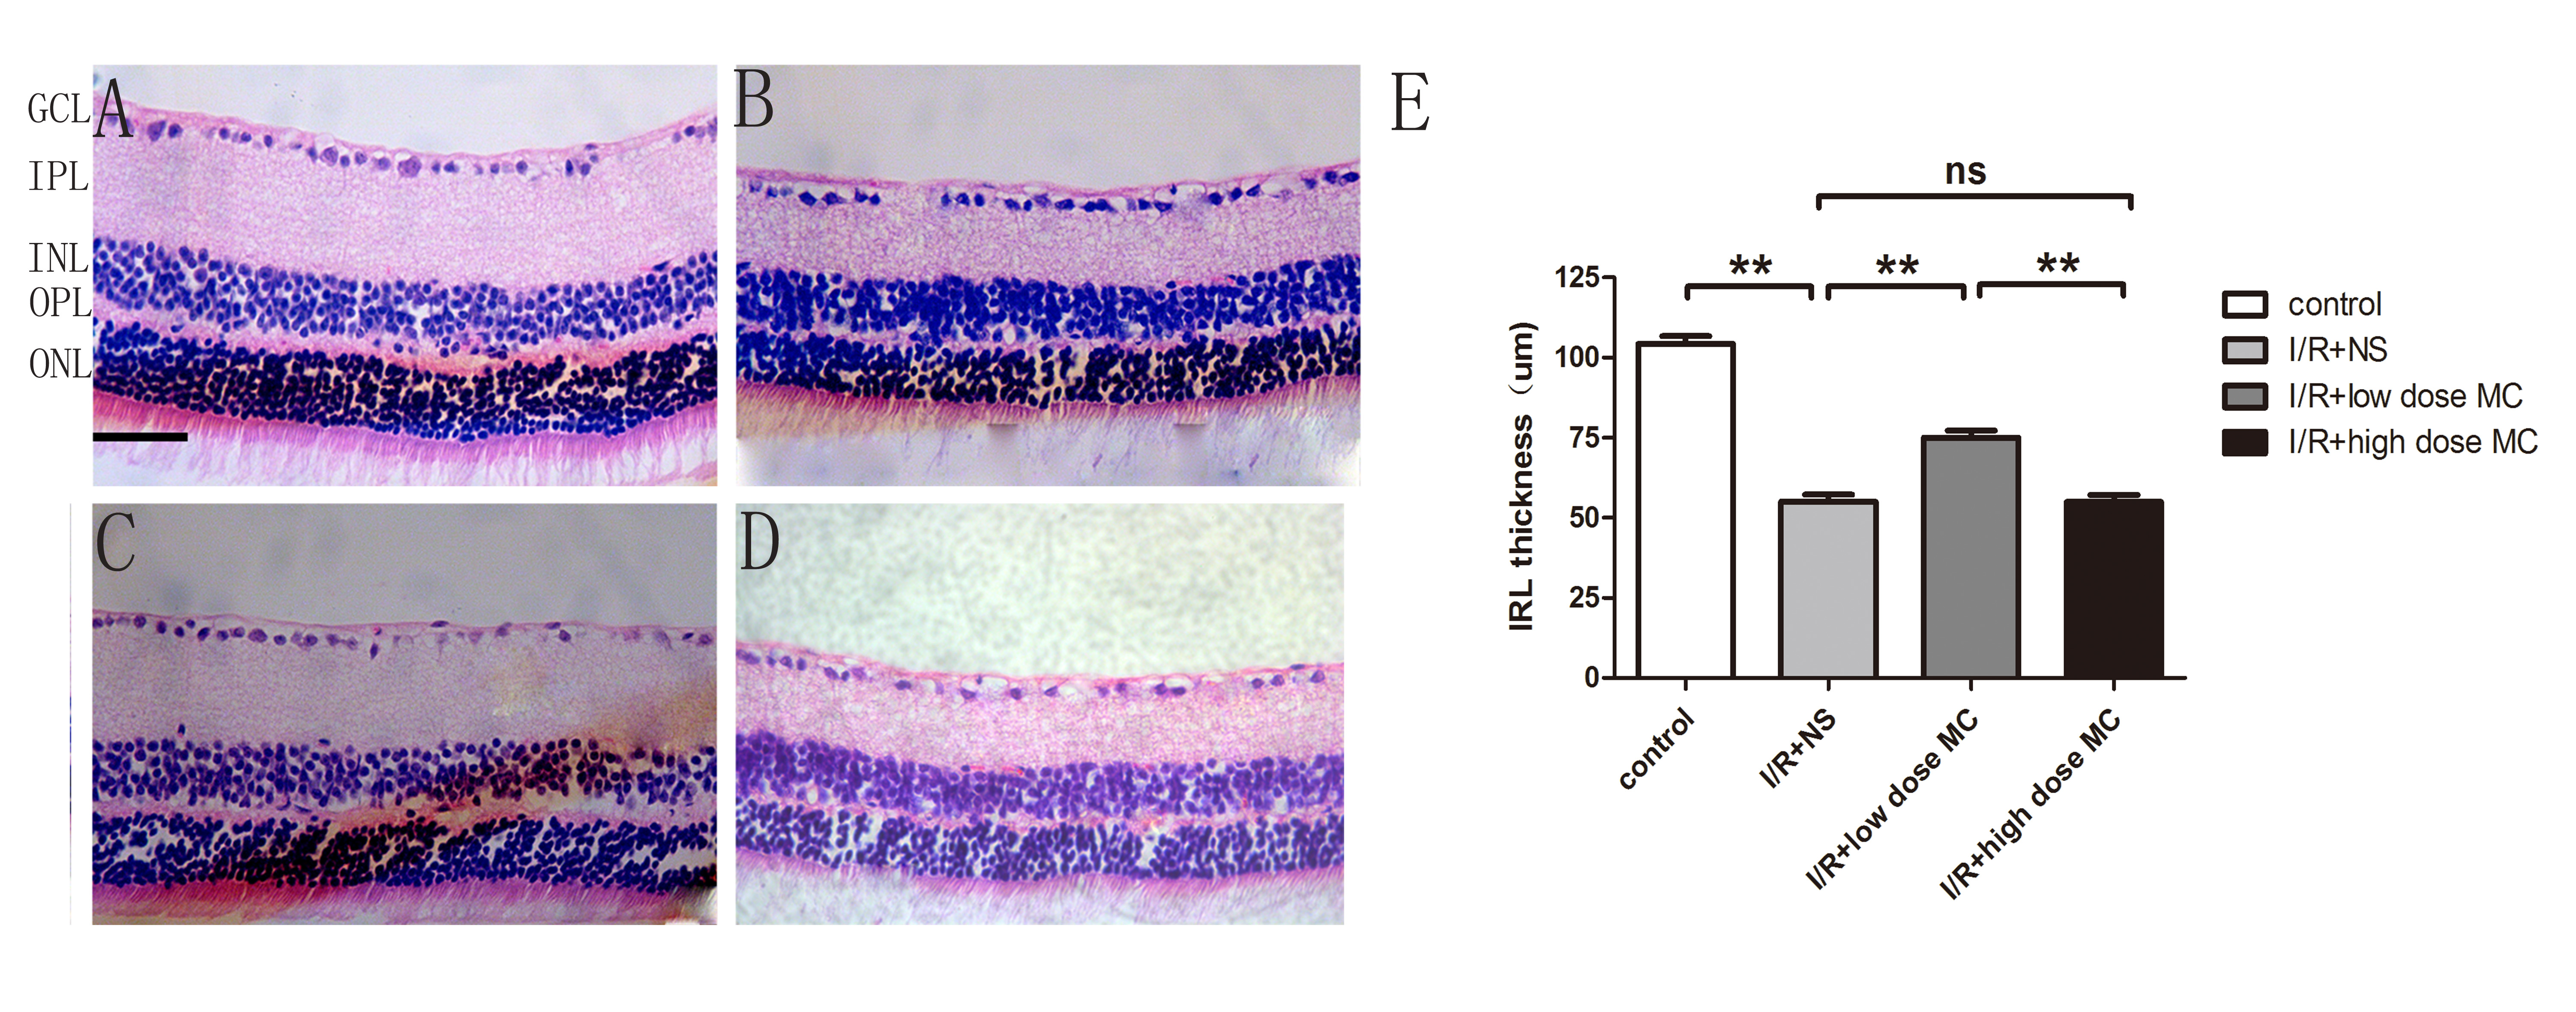
 Figure 2 of
Huang, Mol Vis 2018; 24:367-378.
Figure 2 of
Huang, Mol Vis 2018; 24:367-378.