Figure 3. HSu treatment does not affect neuronal and glial markers. The neuronal markers TUJ-1 (A) and synaptophysin (B) and the glial markers vimentin (C) and glial fibrillary acidic protein (GFAP) (D) were analyzed with immunoblotting in the total retinal extracts obtained from control and high sucrose (HSu) animals. Representative
images of protein immunoreactive bands are presented above the graphs, with the respective loading control (β-actin). The
results are expressed as a percentage of the age-matched controls, and data are presented as mean ± standard error of the
mean (SEM). Representative images from immunohistochemistry of the described proteins (red) are presented below the graphs,
with 4',6-diamidino-2-phenylindole (DAPI; nuclei) staining in blue. Scale bar: 50 μm.
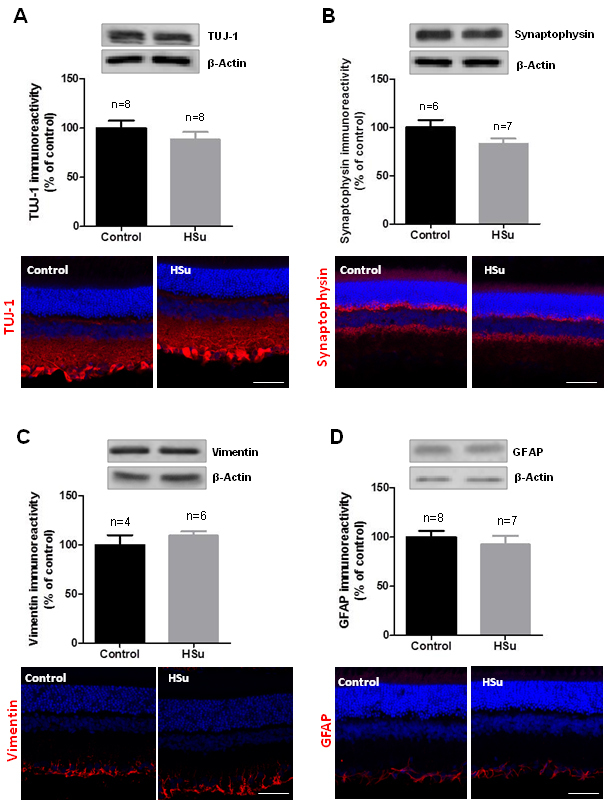
 Figure 3 of
Alves, Mol Vis 2018; 24:353-366.
Figure 3 of
Alves, Mol Vis 2018; 24:353-366.