Figure 2. High sucrose diet induces a decrease in retinal thickness. A: Representative fundus image of a rat eye showing the line scan (green line) and the corresponding retinal tomographic images.
Retinal thickness was assessed in optical coherence tomography (OCT) images obtained from different bright-field eye fundus
scans. B: Retinal tomographic images obtained from the linear scans were used to evaluate the thickness of the retinal layers (the
retinal nerve fiber layer (RNFL), the ganglion cell layer (GCL), and the inner plexiform layer (IPL), the inner nuclear layer
(INL), the outer nuclear layer (ONL), the inner segments (IS) and the outer segments (OS), and the total) from control and
high sucrose (HSu)-treated animals. Data are expressed as a variation in the retinal thickness of the HSu-treated animals
relative to the control animals and are presented as the mean ± standard error of the mean (SEM) of four to six animals. *p<0.05
statistically significantly different from the respective age-matched control. C: Nuclei were stained with 4',6-diamidino-2-phenylindole (DAPI), and the number of DAPI-positive cells in the GCL was counted.
Results are presented as the number of DAPI-positive cells per millimeter of retina and represent the mean fold change of
the control ± SEM. Scale bar: 50 μm. D: Cell death was evaluated with terminal deoxynucleotidyl transferase (TdT) dUTP nick-End labeling (TUNEL) assay (green) in
the control and HSu-treated animals, and in a DNase-positive control. Scale bar: 50 μm. E: The number of retinal ganglion cells (RGCs) was assessed with immunolabeling of the retinal sections with Brn3a (a RGC-specific
marker), and Brn3a mRNA levels were evaluated with quantitative PCR (qPCR). Results are presented as the number of Brn3a-positive
cells per millimeter of retina and represent the mean fold change of the control ± SEM. Scale bar: 50 μm. The qPCR results
are presented as the fold change of the control retinas.
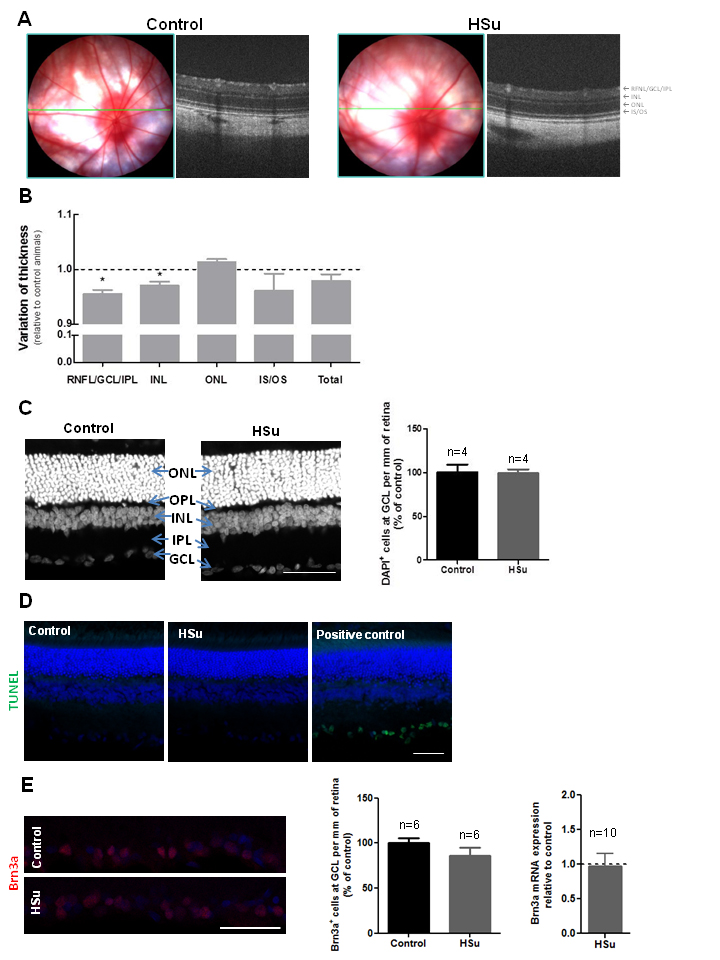
 Figure 2 of
Alves, Mol Vis 2018; 24:353-366.
Figure 2 of
Alves, Mol Vis 2018; 24:353-366.