Figure 5. Effects of exogenous PGF on α-SMA expression in ARPE-19 cells under hypoxia. A: Representative images of immunofluorescence staining of ARPE-19 cells. Increased expression of α-SMA was observed in ARPE-19
cells from the hypoxia+placental growth factor (PGF) group compared to the control group, the hypoxia group, and the PGF group.
Treatment with an NF-κB signaling inhibitor restored this change. Scale bar: 200 μm. B: Quantitative analysis of the fluorescence intensity of α-SMA is shown in the bar graph. Data are the mean ± standard deviation
(SD), n = 3, *p<0.05 versus the other four groups.
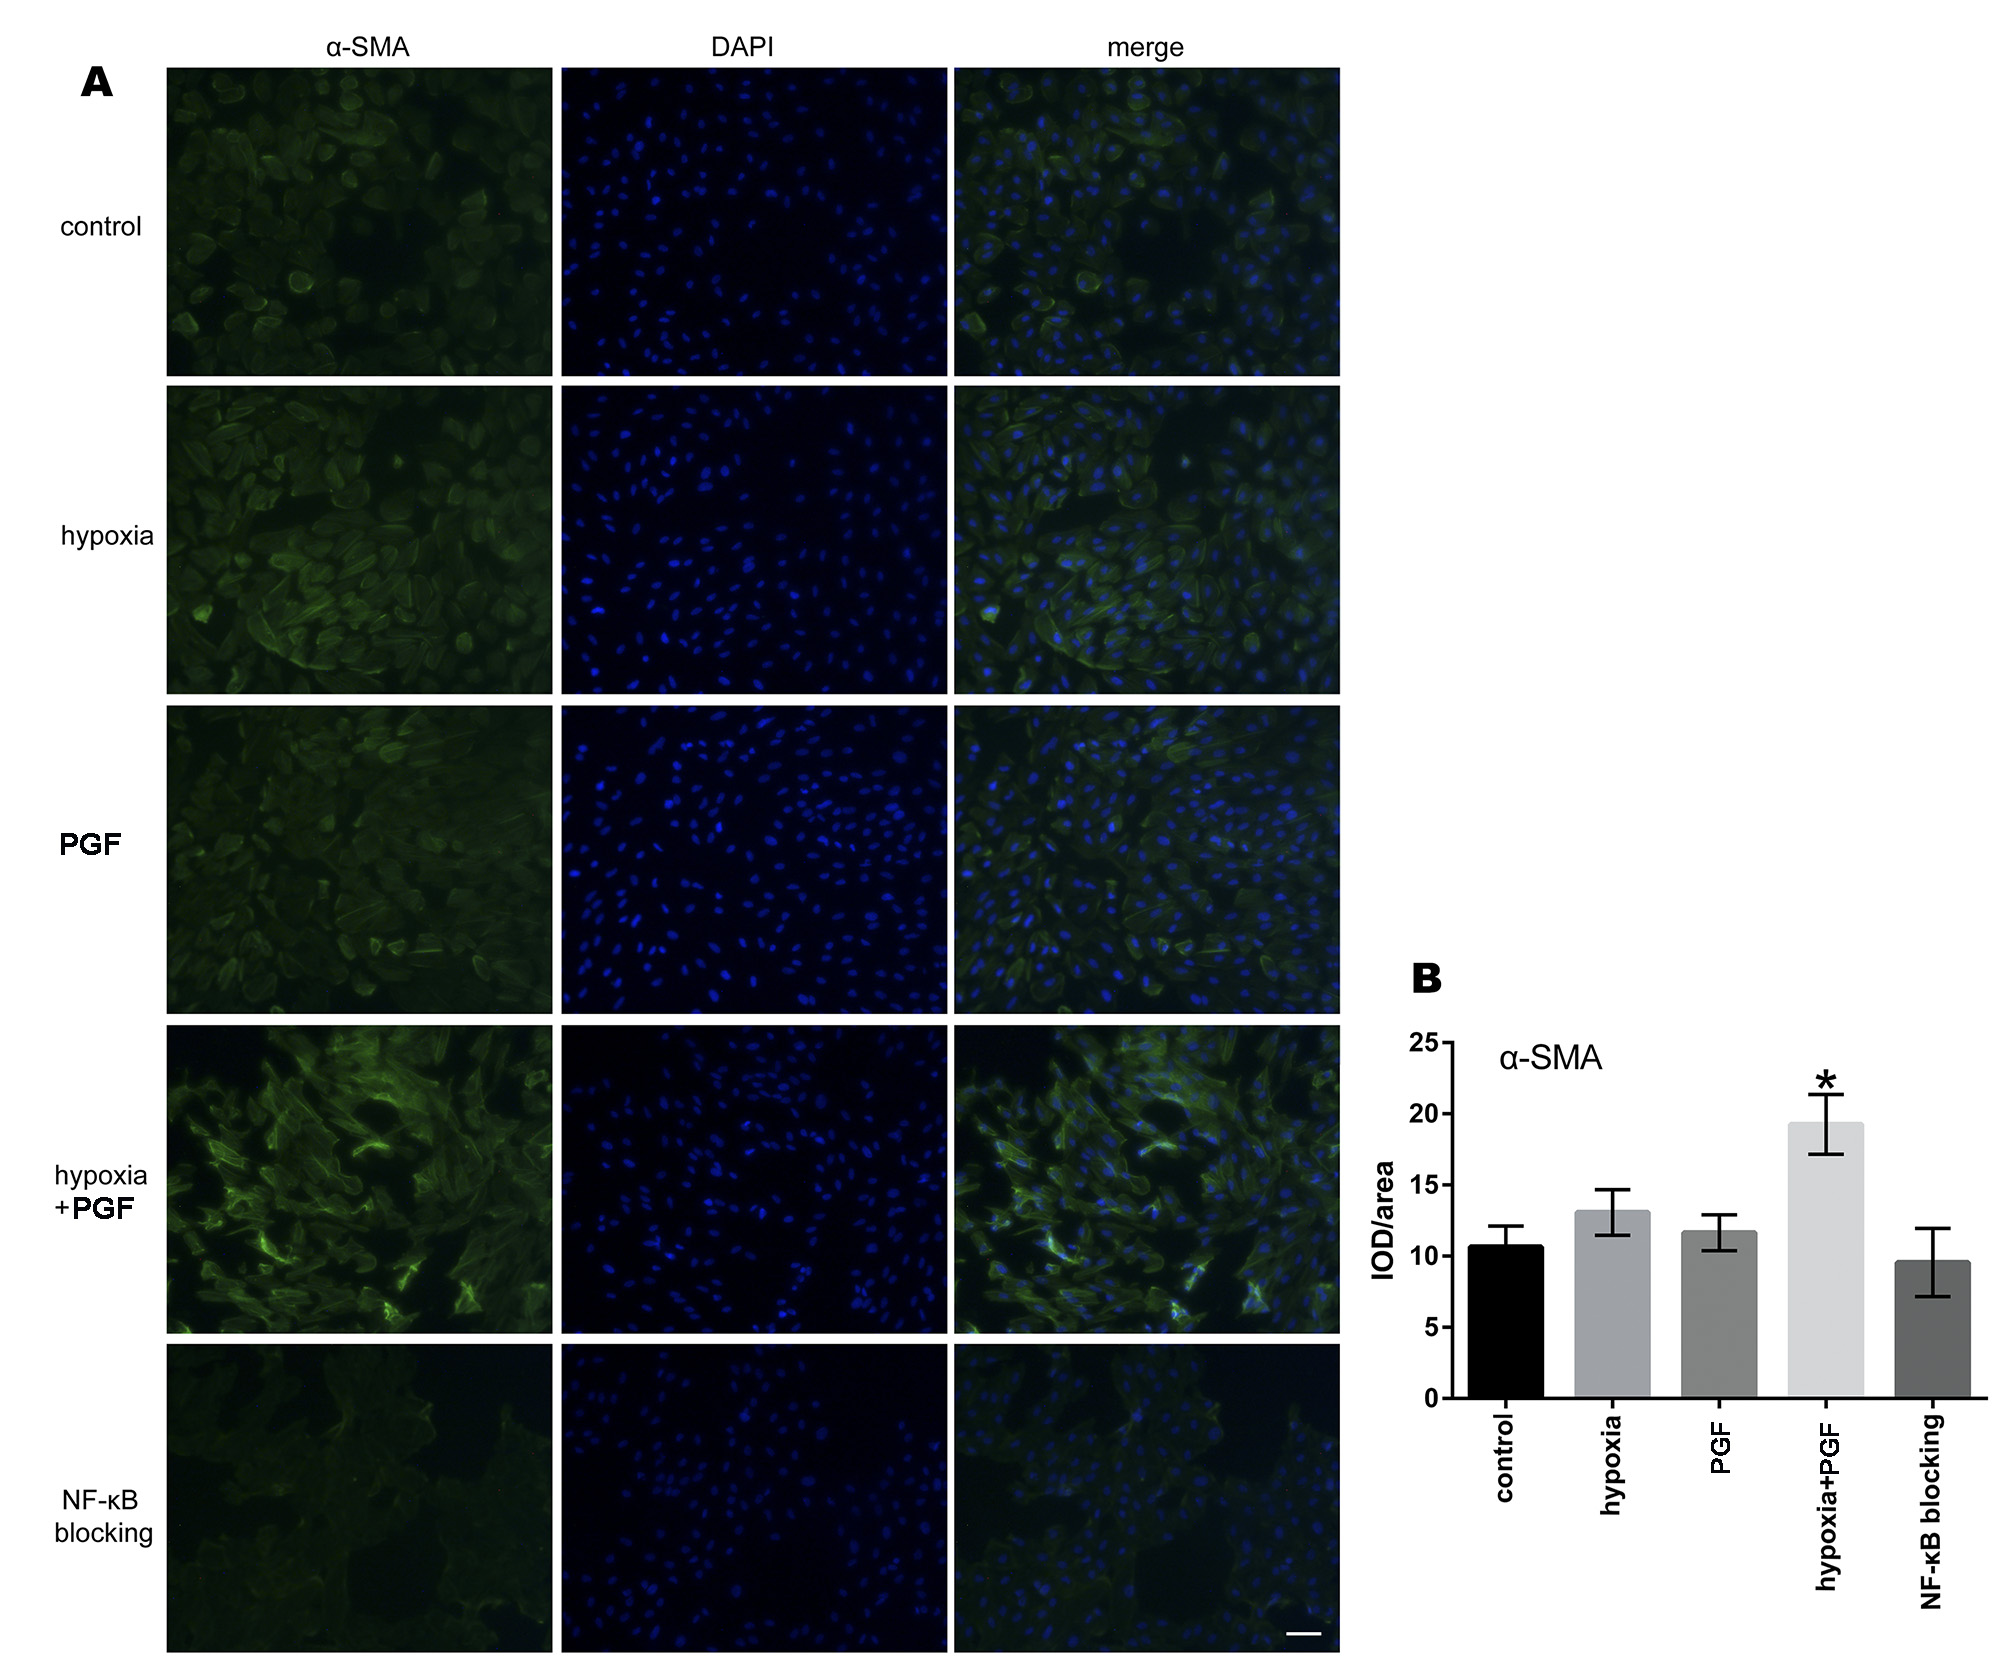
 Figure 5 of
Zhang, Mol Vis 2018; 24:340-352.
Figure 5 of
Zhang, Mol Vis 2018; 24:340-352.