Figure 4. Effects of exogenous PGF on EMT in ARPE-19 cells under hypoxia. A: Relative mRNA expression levels of α-SMA and ZO-1 in the control group, the hypoxia group, and the hypoxia+placental growth
factor (PGF) group. The relative mRNA expression levels of α-SMA and ZO-1 were increased and decreased, respectively, in the
ARPE-19 cells from the hypoxia+PGF group compared with cells from the other two groups (*p<0.05, data are the mean ± standard
deviation [SD], n = 3). B: Representative protein blots of α-SMA, E-cadherin, ZO-1, IκB-α, and phospho-p65 (p-p65) in the total protein samples and
the semiquantitative analyses of the protein expression levels. β-actin was used as the internal reference. C: Representative protein blots of IκB-α and p-p65 in the cytoplasmic protein samples and the semiquantitative analyses of
the protein expression levels. β-actin was used as the internal reference. D: Representative protein blots of p-p65 and p65 in the nuclear protein and semiquantitative analyses of the protein expression
levels. Histone H3 was used as the nuclear internal reference. Data are the mean ± standard deviation (SD), n = 3, *p<0.05
versus the other three groups.
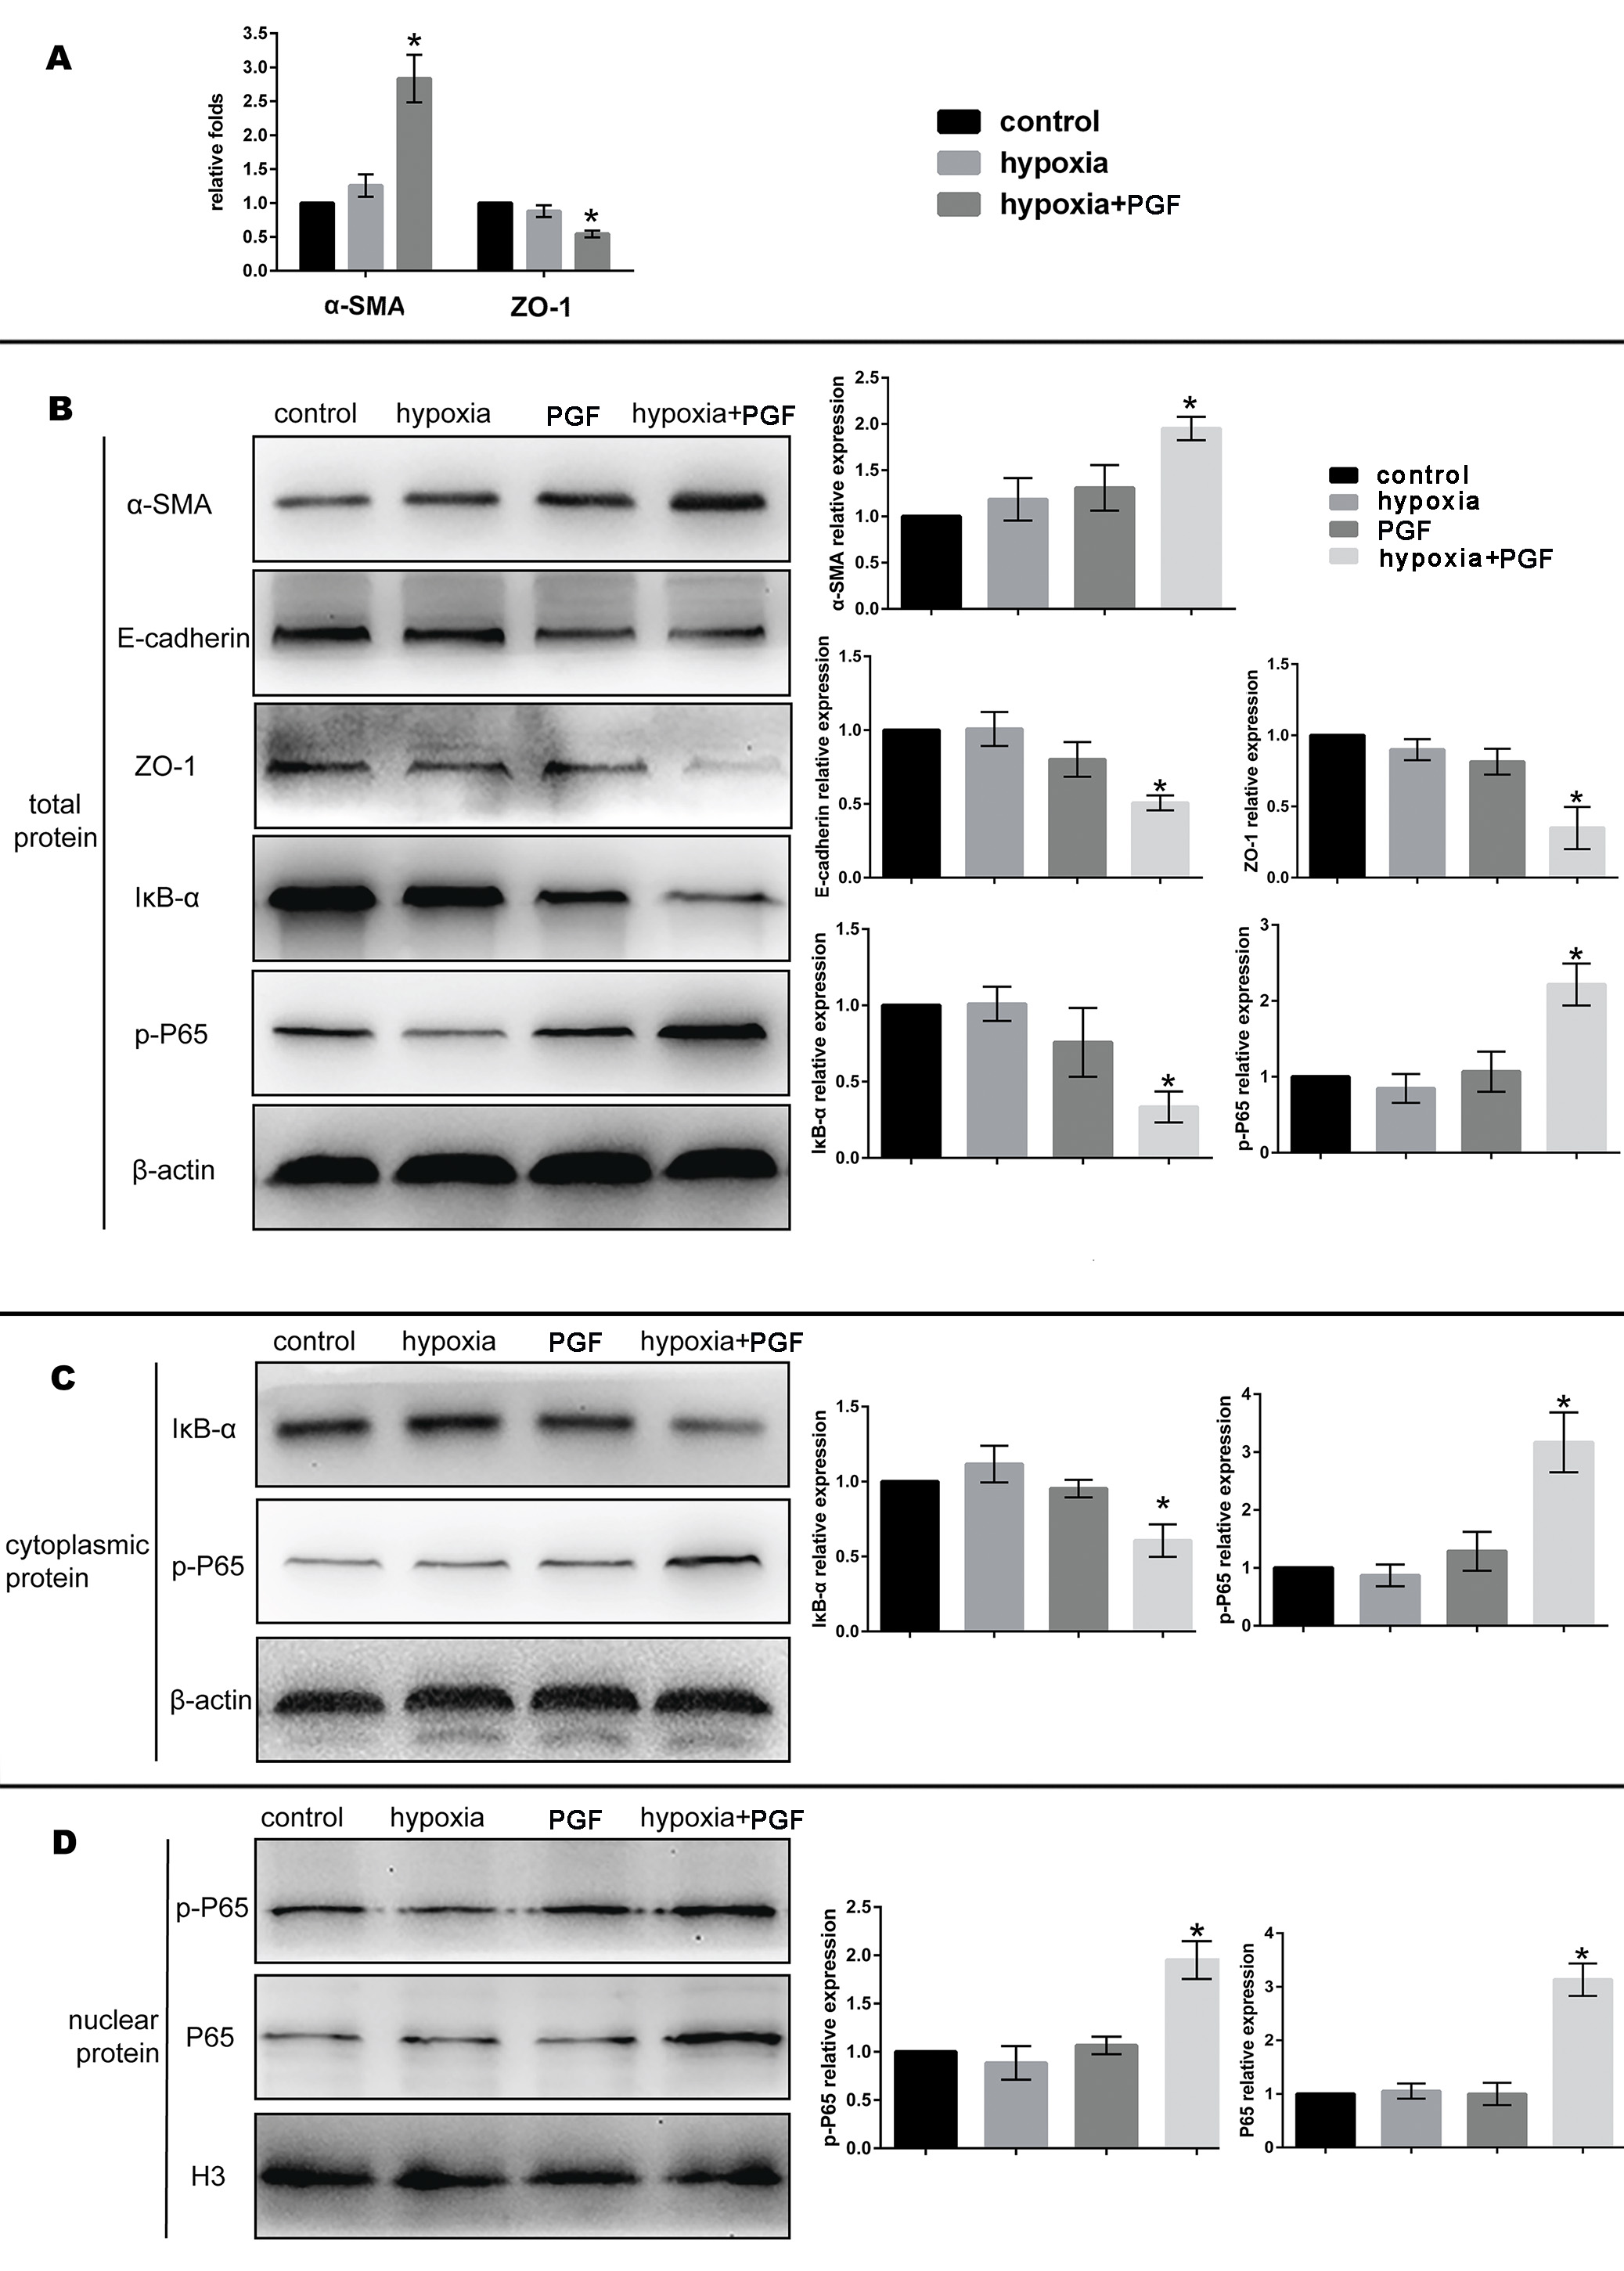
 Figure 4 of
Zhang, Mol Vis 2018; 24:340-352.
Figure 4 of
Zhang, Mol Vis 2018; 24:340-352.