Figure 3 of
Wawrocka, Mol Vis 2018; 24:326-339.
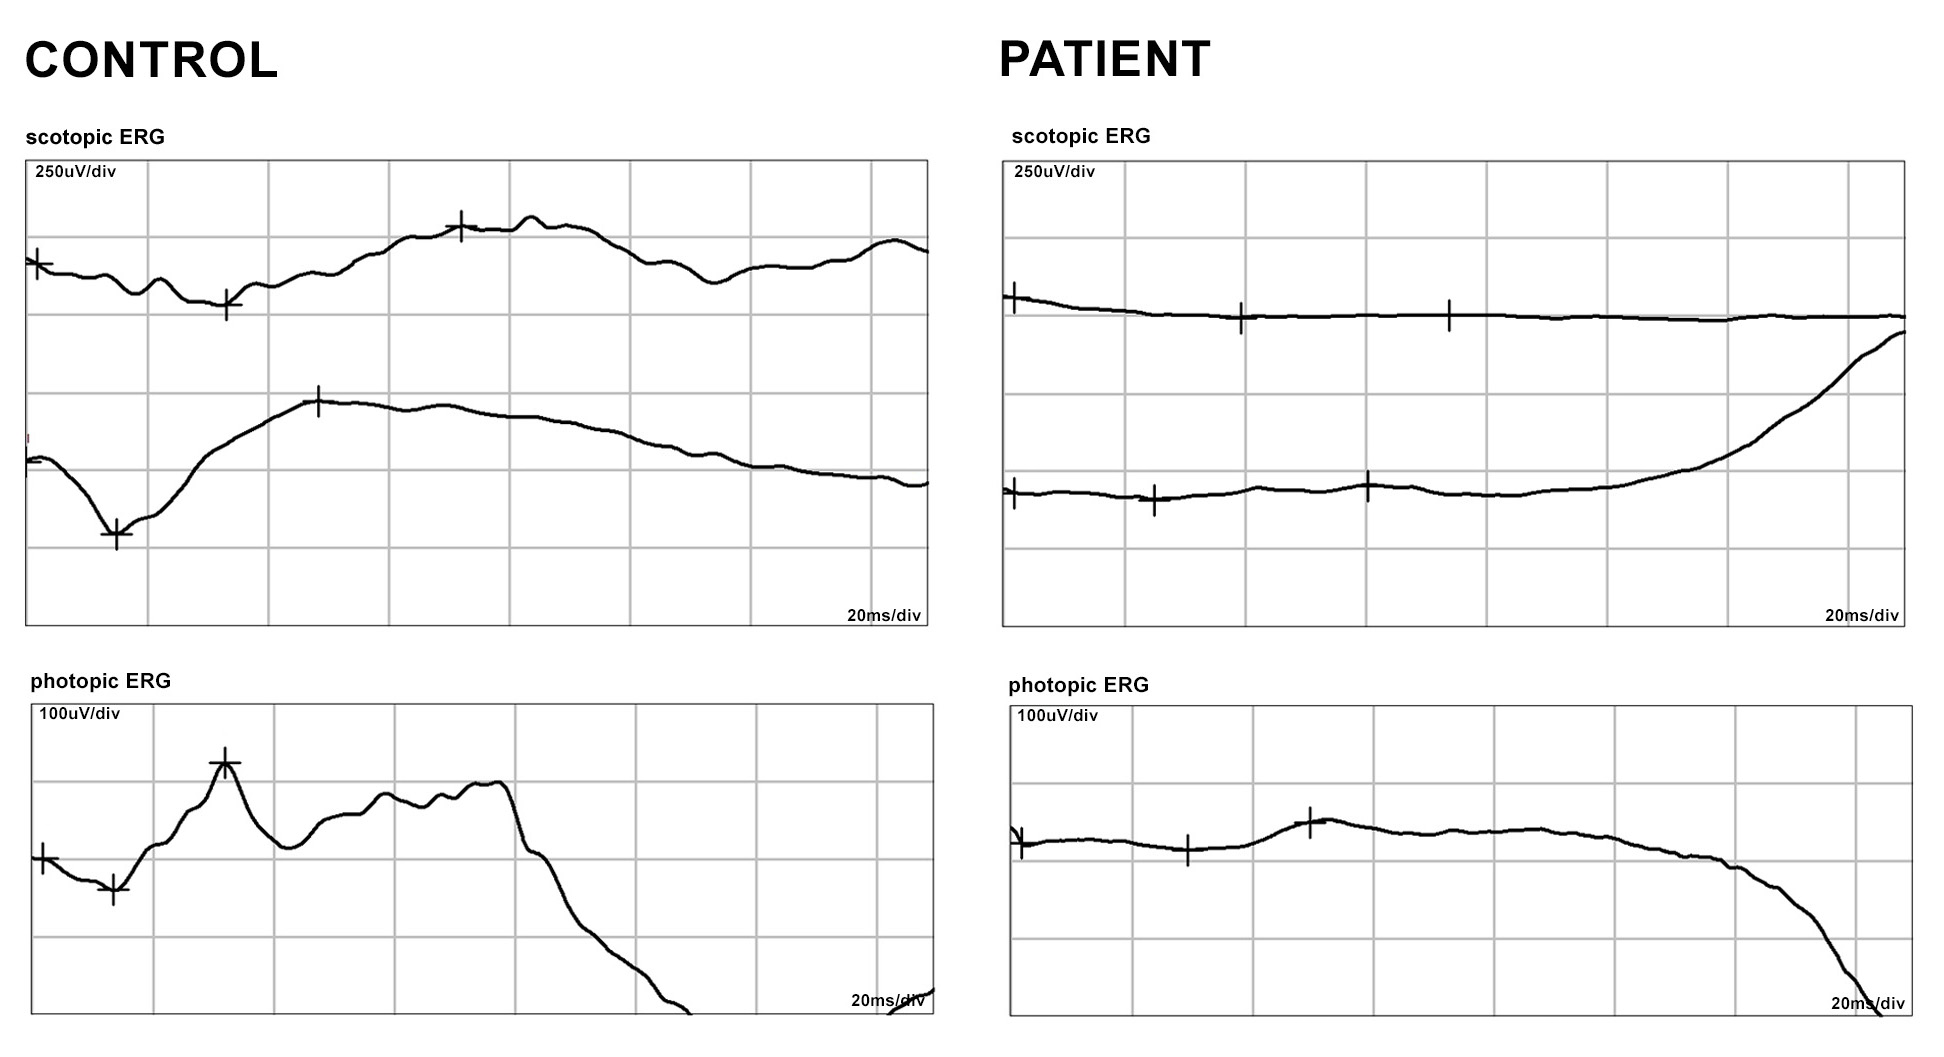
Figure 3.
ERG data from a patient with CRD (Family 9). The left panel shows the electroretinograms (ERGs) of a normal healthy individual; the right panel shows the ERGs of the patient, which show the extinguished rod and cone response.
 Figure 3 of
Wawrocka, Mol Vis 2018; 24:326-339.
Figure 3 of
Wawrocka, Mol Vis 2018; 24:326-339.