Figure 4. RGC survival rate. The three rows in the top panels are representative images of Fluoro-Gold (FG)–labeled retinal ganglion
cells (RGCs). The nuclei of the RGCs are stained blue. “Normal” represents the non-treated control group (top row), “EBHM”
represents scutellarin treatment in the high intraocular pressure (HIOP) model group (middle row), and “HIOP model” represents
the HIOP model group (bottom row). The columns labeled “1-1,” “1-2,” and “1-3” represent distances of 1, 2, and 3 mm radially
outward from the optic nerve (ON) head in the nasal superior quadrant of the retina, respectively. The graph shows the results
of the statistical analysis. The number of RGCs was statistically significantly higher in the scutellarin treatment group
than in the HIOP model group. The original retinal tissues that were made into flat mounts were obtained from six eyes in
each group. Data are shown as mean ± standard error of the mean (SEM). “***” refers to survival rate of RGC in the HIOP model
group compared to the normal control group, p<0.001.
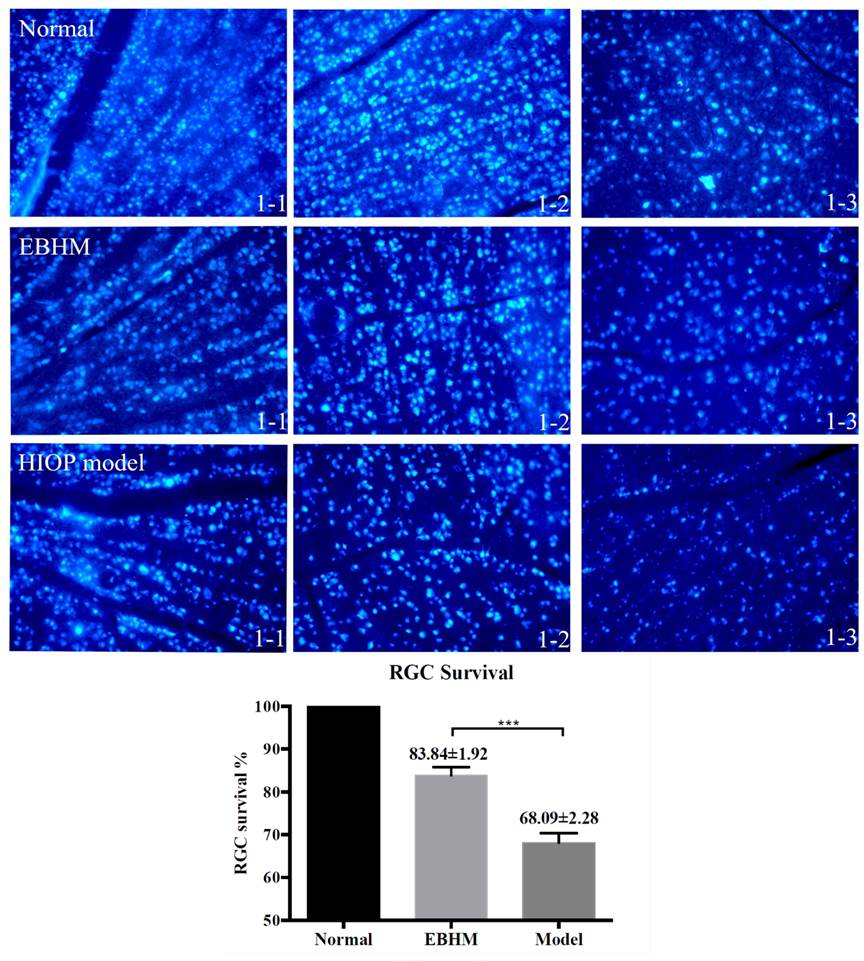
 Figure 4 of
Zhu, Mol Vis 2018; 24:315-325.
Figure 4 of
Zhu, Mol Vis 2018; 24:315-325.