Figure 3. Expression levels of inflammasome components in rats in vivo. A–C: Results of the statistical analyses of the western blots probing NLRP3 (A), ASC (B), and cleaved caspase-1 (C). Panel (A) “**” refers to NLRP3 in HIOP + EBHM group/normal control ratio versus HIOP model group/normal control ratio, p<0.01; Panel
(B) “**” refers to ASC in HIOP + EBHM group/normal control ratio versus the HIOP model group/normal control ratio, p<0.01; Panel
(C) “**” refers to cleaved caspase-1 in HIOP + EBHM group/normal control ratio versus the HIOP model group/normal control ratio,
p<0.01; D: Representative blot images. E, F: Results of the statistical analyses of the enzyme-linked immunosorbent assays (ELISAs) for interleukin (IL)-18 (E) and IL-1β (F). The levels of all proteins were downregulated after scutellarin treatment when compared with the levels in the high intraocular
pressure (HIOP) model. The retinal tissues were obtained from six eyes in each group. Data are represented as mean ± standard
error of the mean (SEM) of the fold changes. Each experiment was repeated at least three times. Panel (E) “**” refers to IL-18 in HIOP + EBHM group/normal control ratio versus the HIOP model group/normal control ratio, p<0.01;
Panel (F) “*” refers to IL-1β in HIOP + EBHM group/normal control ratio versus the HIOP model group/normal control ratio, p<0.05..
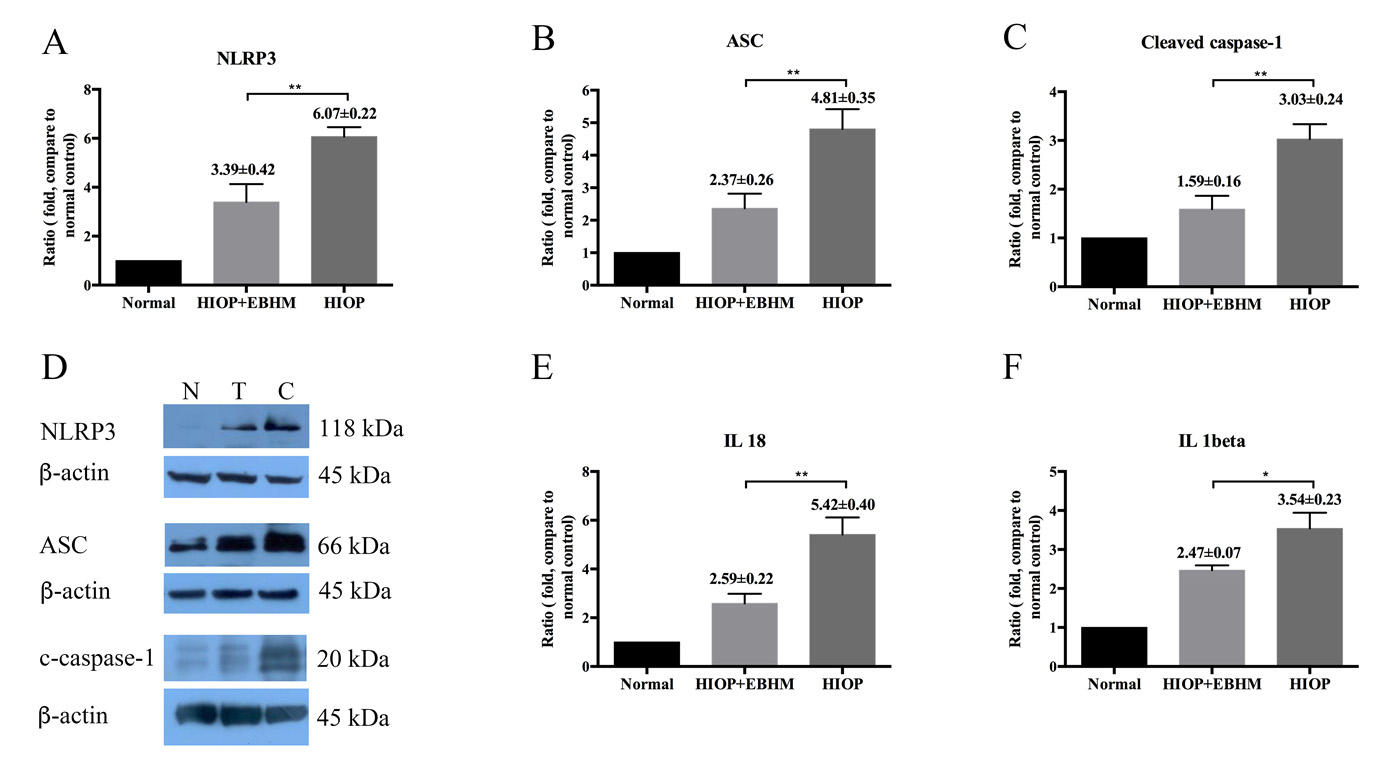
 Figure 3 of
Zhu, Mol Vis 2018; 24:315-325.
Figure 3 of
Zhu, Mol Vis 2018; 24:315-325.