Figure 2. Expression levels of inflammasome components in microglial cells in vitro. A–C: Results of the statistical analyses of the western blots probing NLRP3 (A), ASC (B), and cleaved caspase-1 (C). Panel (A) “**” refers to NLRP3 in hypoxia + EBHM group/normal control ratio versus hypoxia model group/normal control ratio, p<0.01;
Panel (B) “**” refers to ASC in hypoxia + EBHM group/normal control ratio versus the hypoxia model group/normal control ratio, p<0.01;
Panel (C) “*” refers to cleaved caspase-1 in hypoxia + EBHM group/normal control ratio versus the hypoxia model group/normal control
ratio, p<0.05. D: Representative blot images. E, F: Results of the statistical analyses of the enzyme-linked immunosorbent assays (ELISAs) for interleukin (IL)-18 (E) and IL-1β (F). The levels of all proteins were downregulated after scutellarin treatment when compared with the levels in the hypoxia
model. The number of BV-2 cells was 5 × 10⁶ in each group. Data are represented as mean ± standard error of the mean (SEM) of the fold changes. Each experiment was repeated
at least three times. Panel (E) “**” refers to IL-18 in hypoxia + EBHM group/normal control ratio versus the hypoxia model group/normal control ratio, p<0.01;
Panel (F) “*” refers to IL-1β in hypoxia + EBHM group/normal control ratio versus the hypoxia model group/normal control ratio, p<0.05.
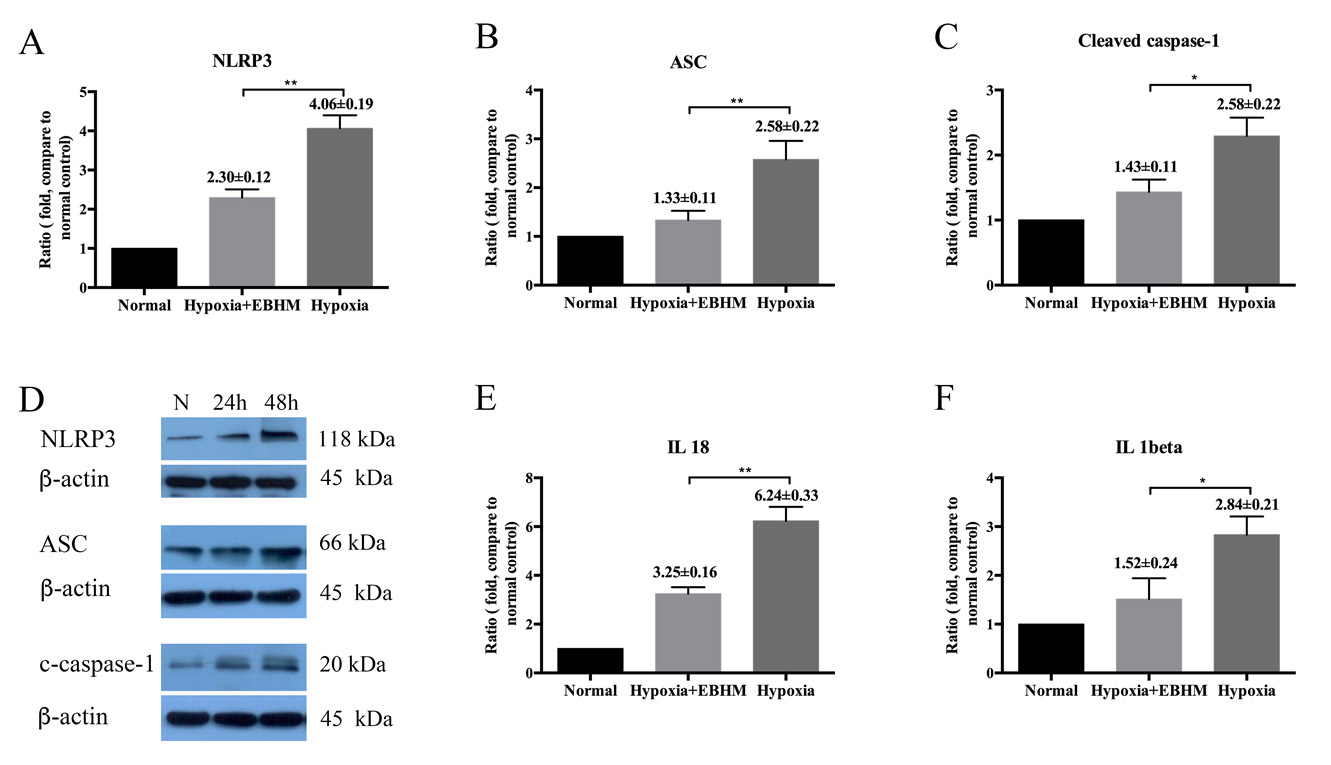
 Figure 2 of
Zhu, Mol Vis 2018; 24:315-325.
Figure 2 of
Zhu, Mol Vis 2018; 24:315-325.