Figure 1. Cell viability in microglial cells in vitro. Cell viability of BV-2 microglial cells after 24 h (A) and 48 h (B). “Normal” represents the non-treated control group, “Hypoxia” represents the hypoxia model group, and “Hypoxia + EBHM” followed
by “2 µM,” “10 µM,” or “50 µM” represent the three concentrations of scutellarin treatment used in the hypoxia model group.
The number of viable cells was 5 × 10³ in each group. The number of cells decreased statistically significantly under hypoxia but was markedly elevated following
treatment with scutellarin. The data are expressed as mean ± standard deviation (SD). Each experiment was repeated at least
three times. Panel (A) “**” refers to cell viability in 24 h, 10 μM hypoxia+ EBHM group versus normal control, p<0.01; “***” refers to cell viability
in 24 h, 50 μM hypoxia+ EBHM group versus normal control, p<0.001. Panel (B) “***” refers to cell viability in 48 h, 10 μM hypoxia+ EBHM group versus normal control, p<0.001; “***” refers to cell viability
in 48 h, 50 μM hypoxia+ EBHM group versus normal control, p<0.001.
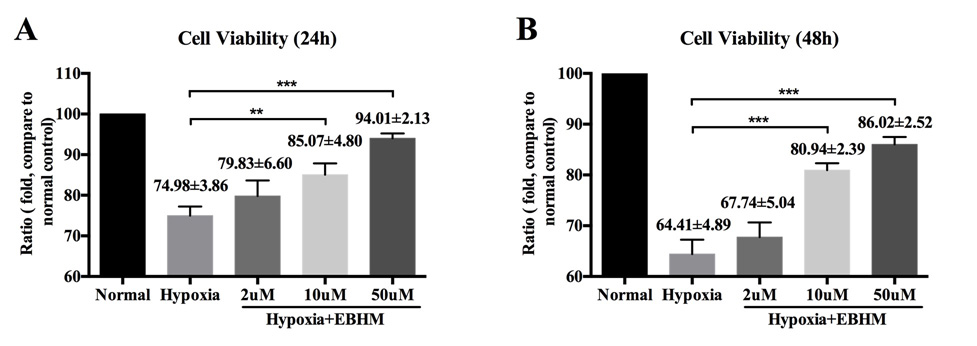
 Figure 1 of
Zhu, Mol Vis 2018; 24:315-325.
Figure 1 of
Zhu, Mol Vis 2018; 24:315-325.