Figure 3. Localization of αA-minichaperone–binding regions in αAG98R-crystallin. The underlined sequences in red represent regions of
αAG98R that interact with the photoactive peptide chaperone from liquid chromatography–mass spectrometry (LC-MS) data, further
confirmed with tandem mass spectrometry (MS/MS). The amino acids involved in crosslinking are labeled in blue. The mutant
residue (r) is shown in the lowercase.
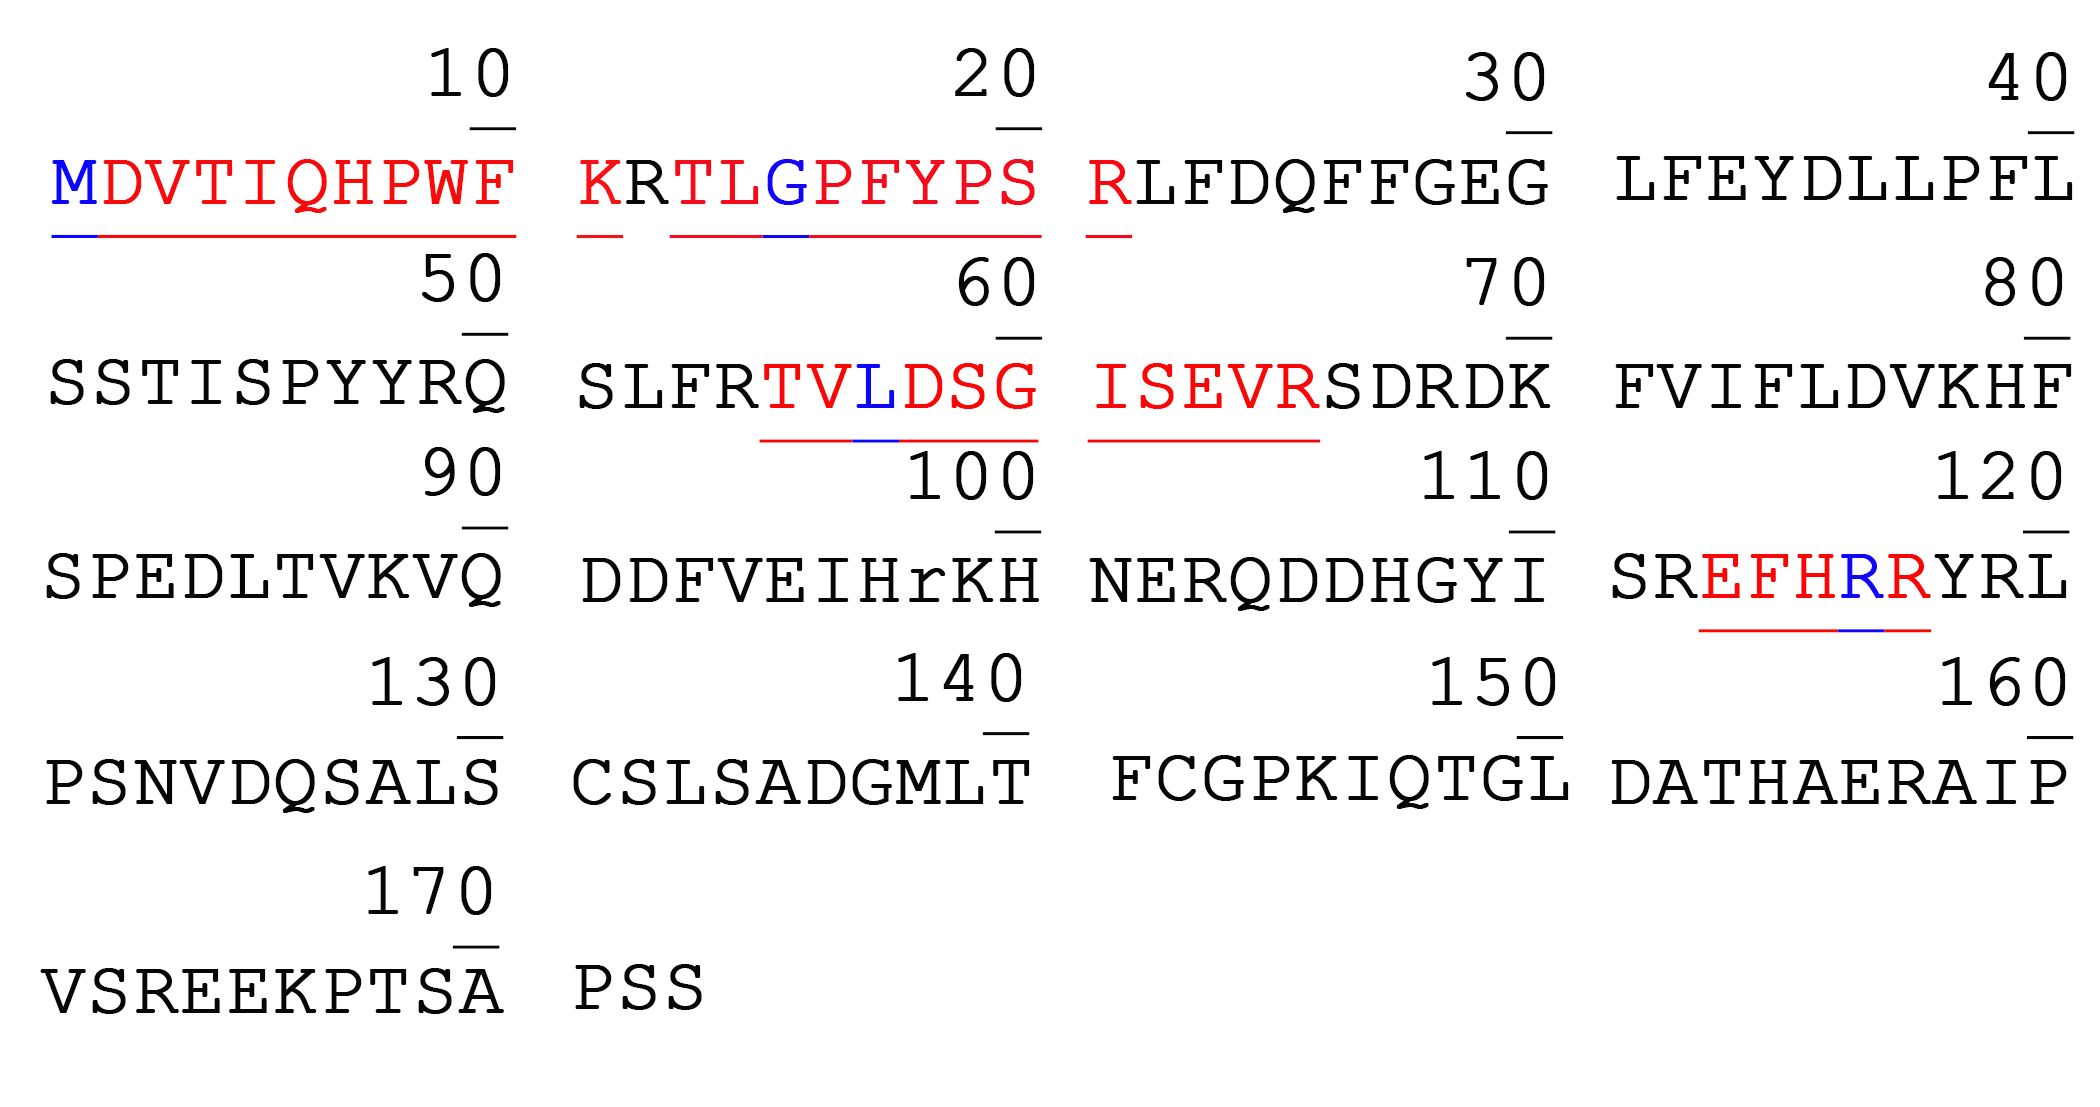
 Figure 3 of
Phadte, Mol Vis 2018; 24:297-304.
Figure 3 of
Phadte, Mol Vis 2018; 24:297-304.