Figure 6. Chromosome 9 two-point single-variant LOD scores. Plot of the single-variant two-point heterogeneity logarithm of the odds
(HLOD) scores produced by TwoPointLods for chromosome 9, which contains single nucleotide polymorphisms (SNPs) that exhibit
suggestive evidence of linkage to myopia. The lines at 1.9 and 3.3 represent the respective suggestive and significant thresholds,
respectively, recommended by Lander and Kruglyak.
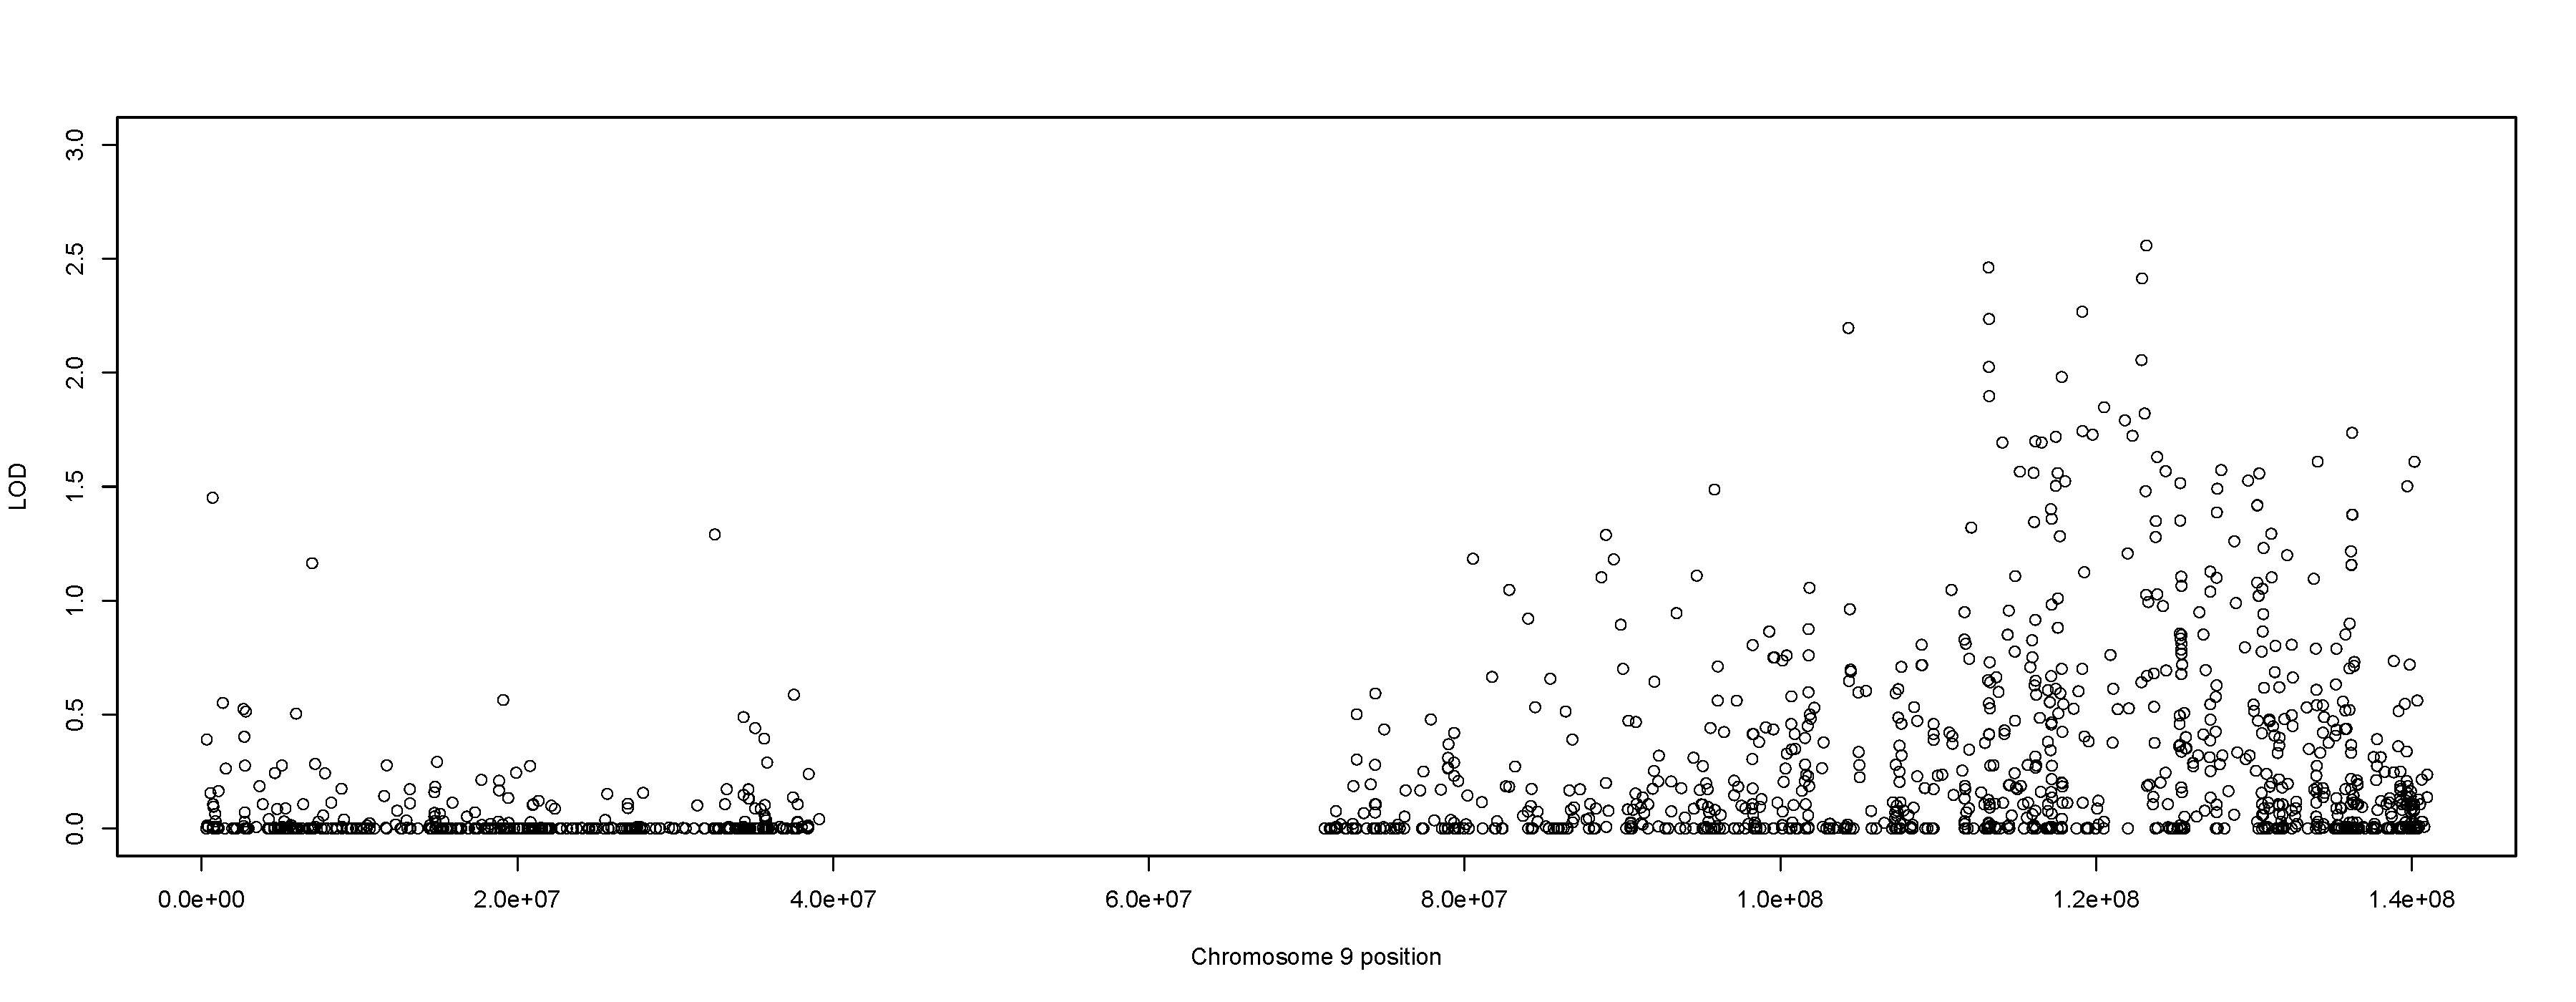
 Figure 6 of
Musolf, Mol Vis 2018; 24:29-42.
Figure 6 of
Musolf, Mol Vis 2018; 24:29-42.