Figure 4. Genome-wide single-variant two-point HLOD scores. Plot showing the single-variant two-point heterogeneity logarithm of the
odds (HLOD) scores produced by TwoPointLods. The lines at 1.9 and 3.3 represent the suggestive and significant thresholds,
respectively, recommended by Lander and Kruglyak.
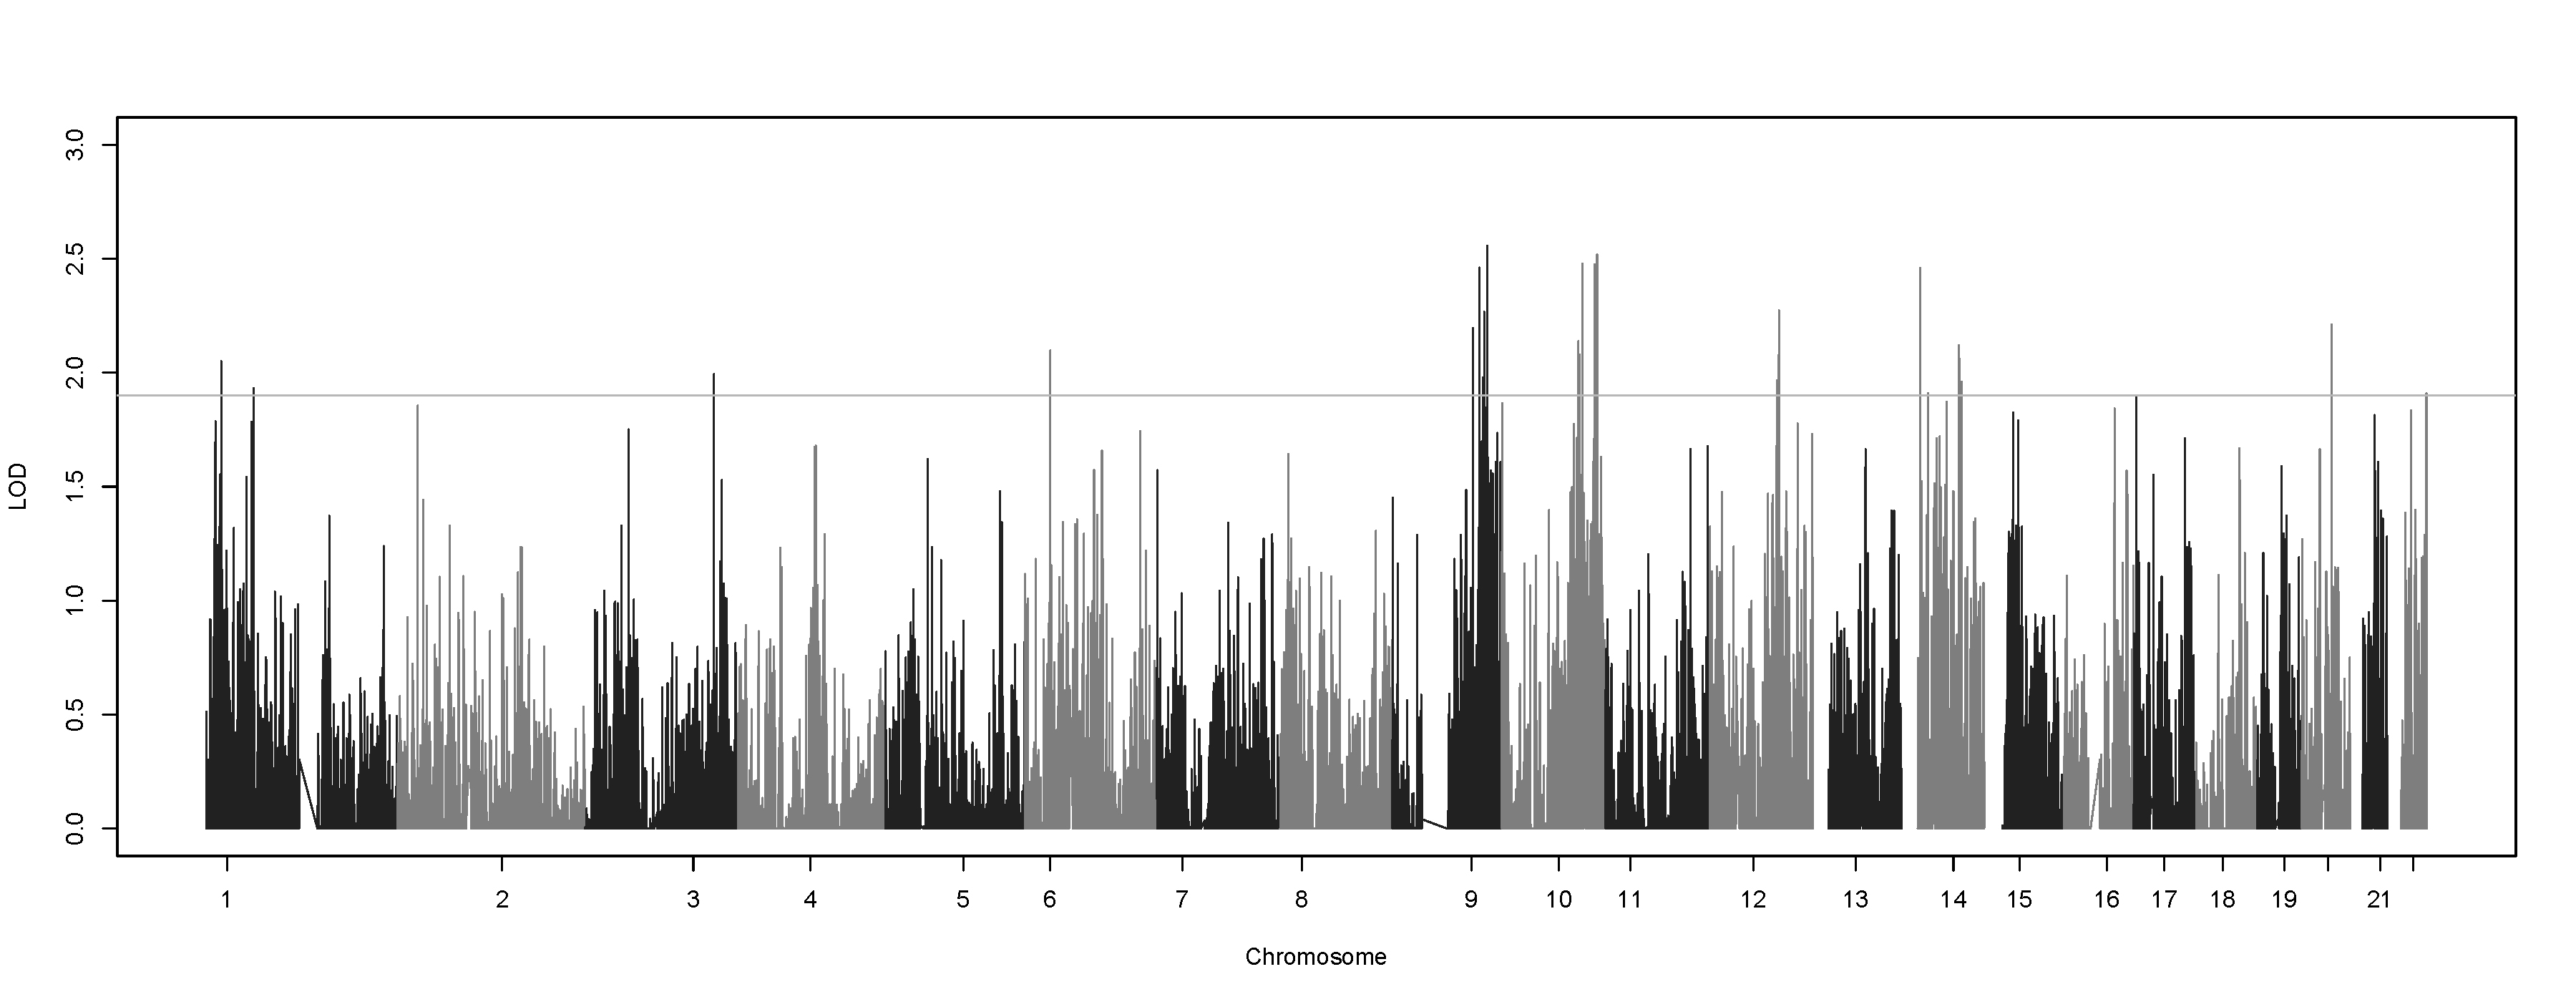
 Figure 4 of
Musolf, Mol Vis 2018; 24:29-42.
Figure 4 of
Musolf, Mol Vis 2018; 24:29-42.