Figure 3. Genome-wide multipoint HLOD scores. Plot of the genome-wide multipoint heterogeneity logarithm of the odds (HLOD) scores produced
by SimWalk2. The lines at 1.9 and 3.3 represent the suggestive and significant thresholds, respectively, recommended by Lander
and Kruglyak.
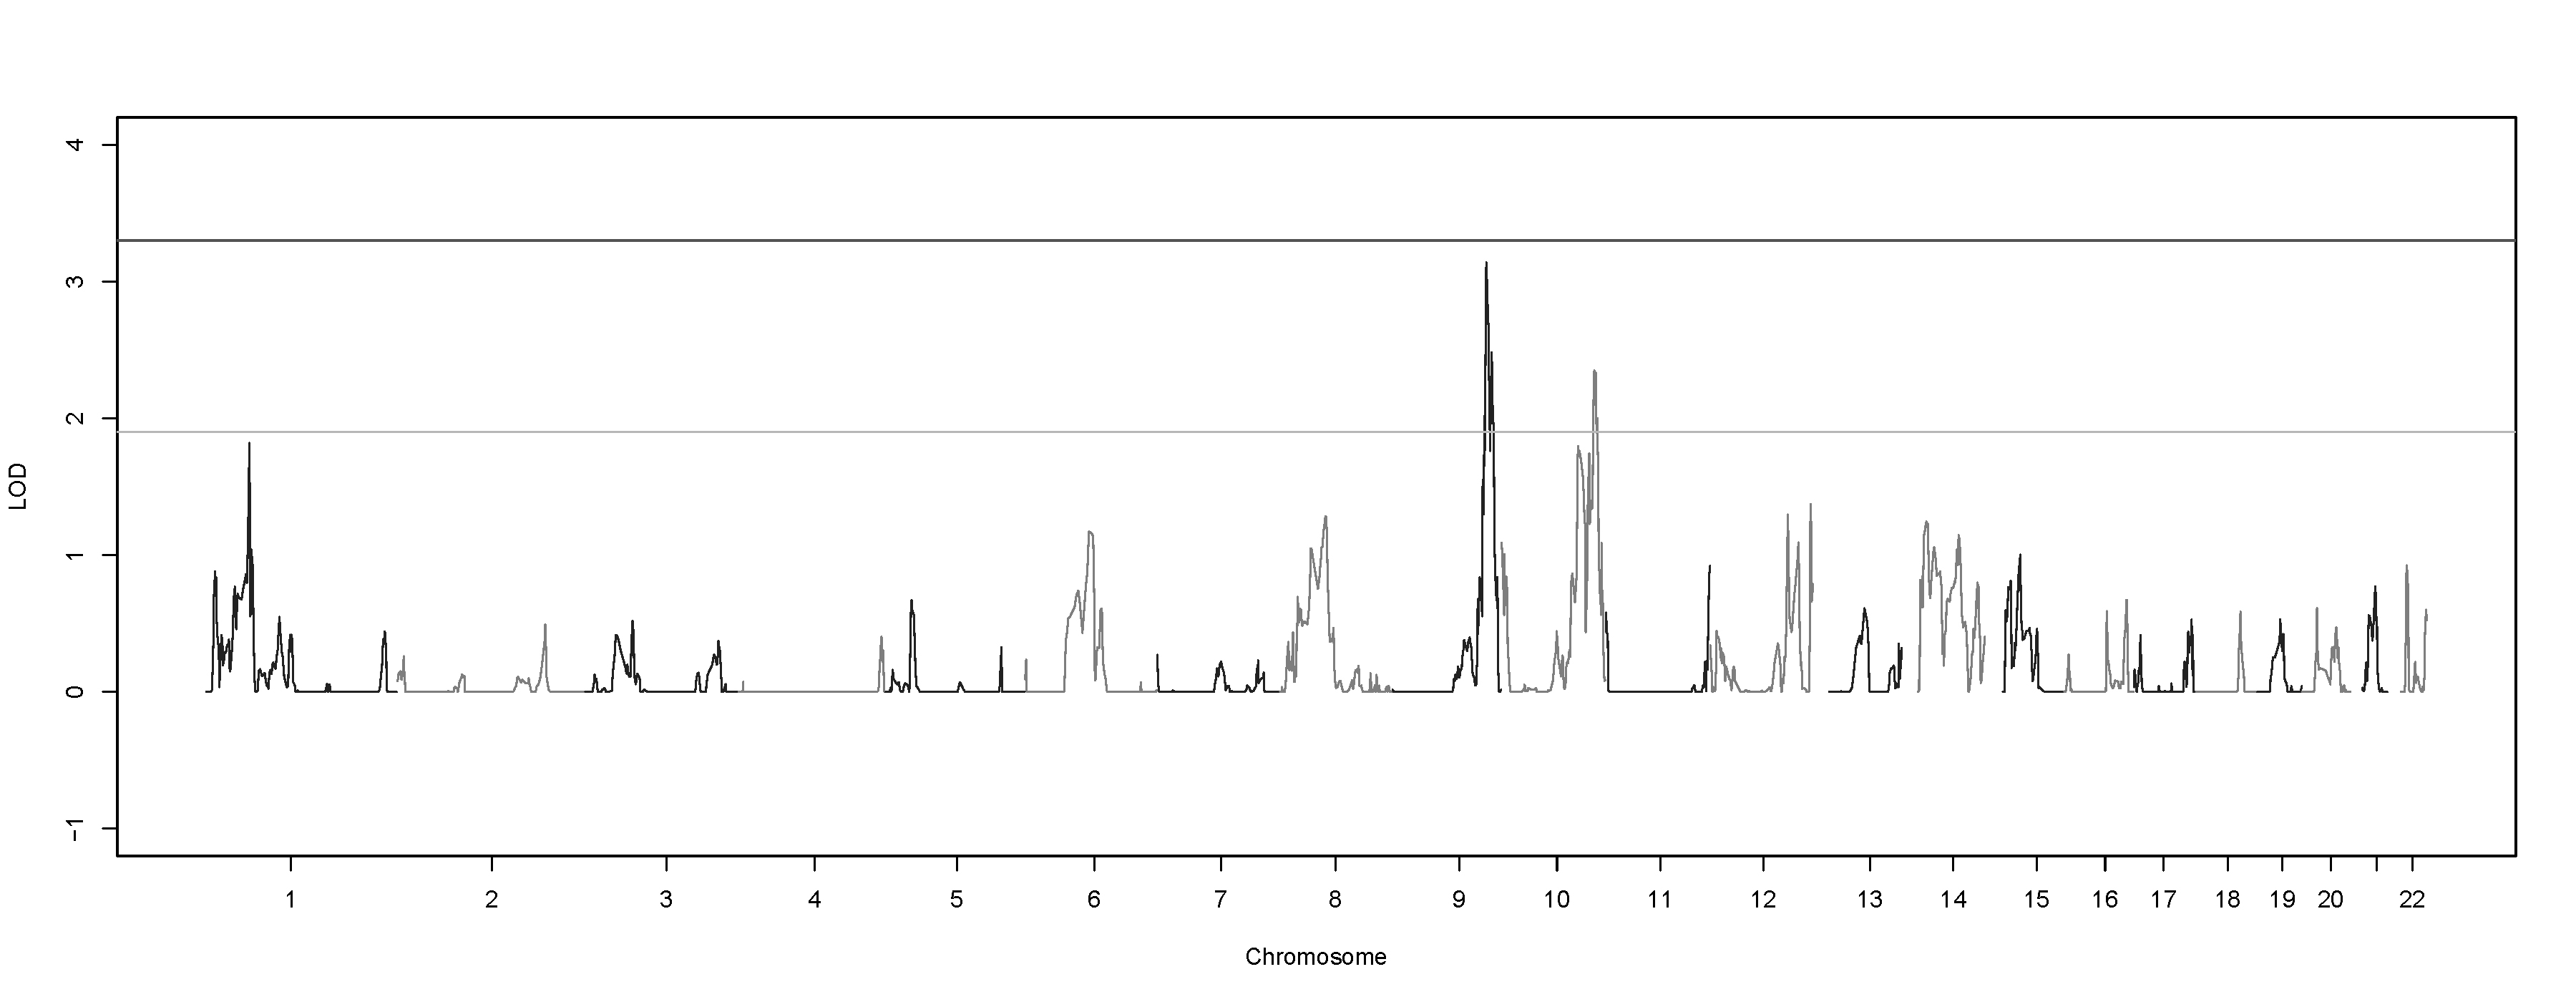
 Figure 3 of
Musolf, Mol Vis 2018; 24:29-42.
Figure 3 of
Musolf, Mol Vis 2018; 24:29-42.