Figure 4. Correlation between APOA1 and RBP4 in each group. APOA1/RBP4 (R=0.594, p=0.003) in the RRDCD group (A) and APOA1/RBP4 (R=0.708, p<0.001) in the RRD group (B). These results confirm the presence of statistically significant positive correlations between APOA1 and RBP4 in the RRDCD
and RRD groups.
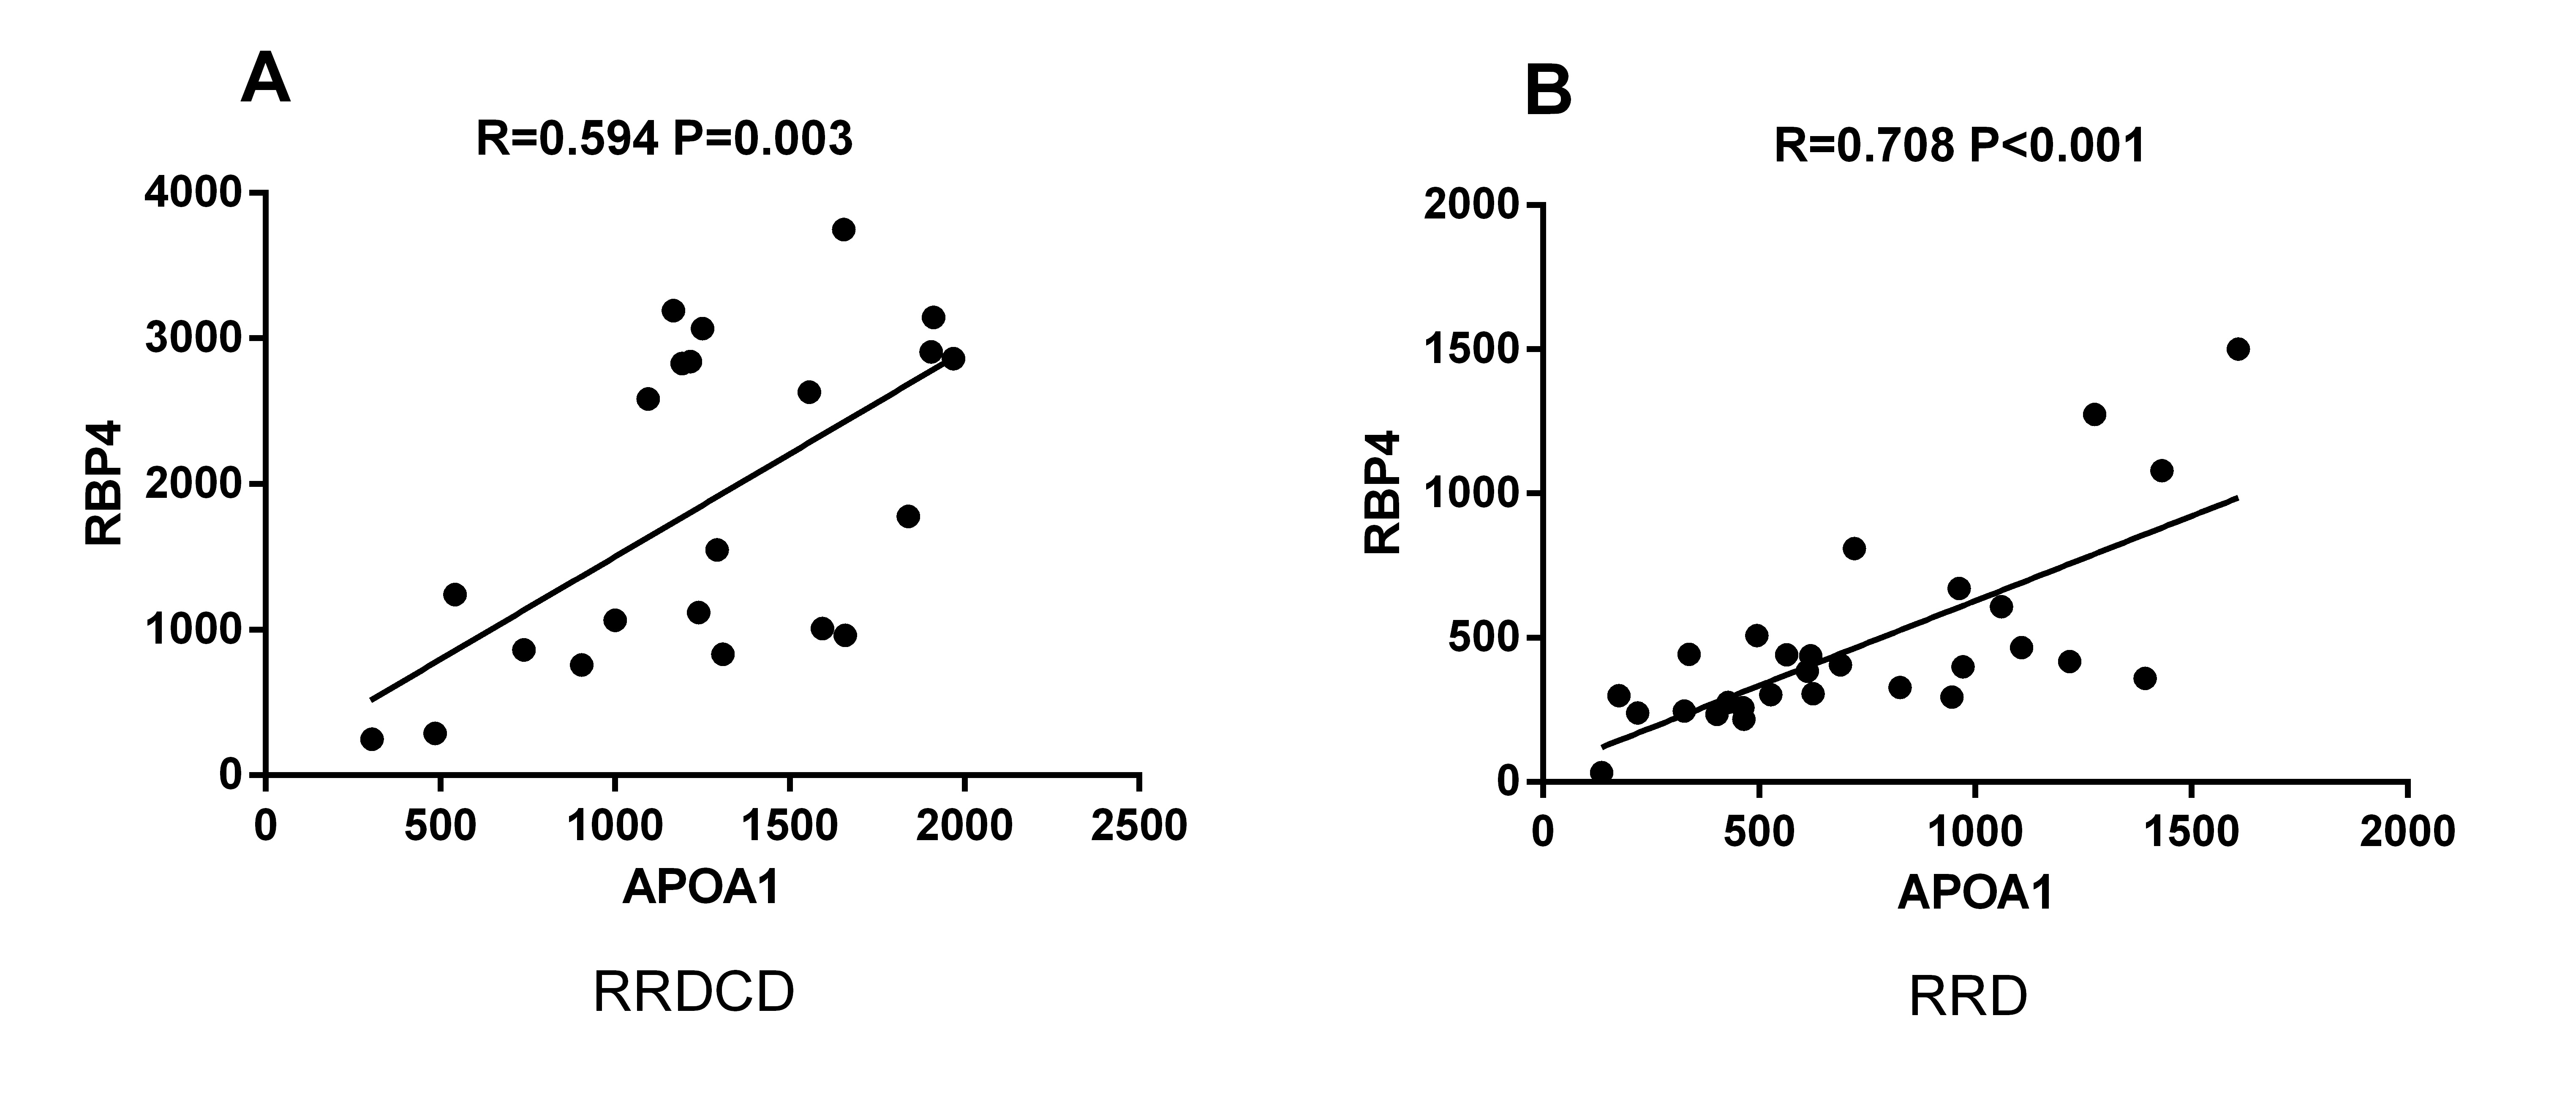
 Figure 4 of
Ding, Mol Vis 2018; 24:252-260.
Figure 4 of
Ding, Mol Vis 2018; 24:252-260.